
Marketing efficiency ratio (MER) equals total revenue divided by total marketing spend, and it tells you exactly how many dollars come back for every dollar you put into marketing. A MER of 4 means $4 in revenue per $1 spent. Calculate it consistently, pair it with ROAS for channel decisions, and use it as your executive-level gut check before approving next quarter's budget.
TL;DR:
- A MER of 4 indicates a company is generating four dollars in revenue for every dollar spent on marketing, but this ratio varies widely based on business type and gross margin.
- To calculate MER accurately, focus on consistent timeframes, define revenue and spend precisely, and document inputs to ensure auditability and comparability.
- Industry benchmarks suggest a healthy MER typically ranges from 3.0× to 5.0×, but each business's break-even MER depends on its gross margin and model.
- MER should be used alongside other metrics like CAC and LTV to inform budgeting, with validation through incrementality testing before reallocating spend.
- Improving MER involves optimizing retention, increasing average order value, diversifying channels, and continually testing to identify truly incremental revenue.
Table of Contents
- What Is Marketing Efficiency Ratio (MER)?
- How to Calculate MER (Step-by-Step With Examples)
- What Is a Good MER? Benchmarks and Setting Real Targets
- MER vs ROAS: What Each One Actually Measures
- Defining Inputs: What Counts as Spend and Revenue
- What MER Hides and How It Can Mislead You
- How to Improve Your MER: Prioritized Tactics That Work
- Using MER for Forecasting, Budgeting, and Reporting
- How Experienced Growth Leaders Actually Use MER
- The Bottom Line on MER
- Why I Treat MER as a Discipline, Not a Vanity Metric
- Ready to Turn MER Into a Real Growth Lever?
- Sources
What Is Marketing Efficiency Ratio (MER)?
MER is a blended, company-level number. It doesn't care which channel gets credit for a sale. It just asks: how much revenue did the whole marketing engine produce relative to what it cost? That's precisely why finance teams like it and why growth teams sometimes resist it.
The blended nature of MER is the point, not a limitation. Attribution models fight over who deserves credit for a purchase. MER skips the argument entirely and looks at the P&L. You lose granularity, but you gain a number nobody can dispute with a different tracking pixel.
Industry writers sometimes call it blended ROAS or media efficiency ratio, and the terms get used almost interchangeably. "Blended ROAS" tends to show up in paid media conversations; "MER" shows up more in finance and executive reporting. Same math, different audience.
Most companies deploy MER in three places: the executive dashboard reviewed monthly, cross-channel budget steering meetings, and as a sanity check when a channel manager claims a campaign is crushing it. If MER isn't moving while a single channel's reported ROAS is soaring, something in the attribution is lying to you.
How to Calculate MER (Step-by-Step With Examples)
Calculating MER correctly takes five minutes once you fix your inputs. Getting sloppy inputs is where most teams go wrong.
- Pick your window. Weekly is too noisy, daily is useless, monthly or quarterly is standard for most businesses.
- Define revenue. Decide once, in writing, whether you're using gross sales, net sales, or first-order revenue, and never switch mid-comparison.
- Define marketing spend. Total every dollar tied to acquisition and retention marketing for that same window.
- Apply the formula. MER = total revenue ÷ total marketing spend.
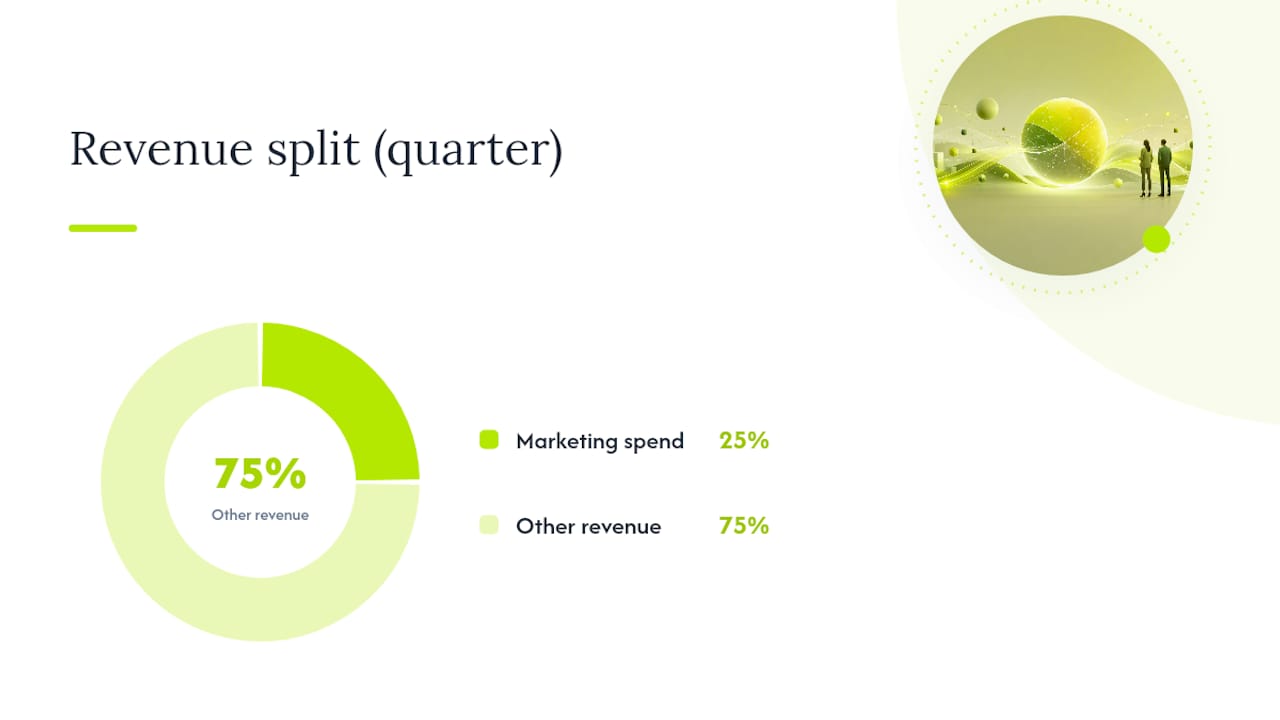
- Present it both ways. Report MER as a multiple (4.0×) for internal teams and as a percentage (25% of revenue spent on marketing) for finance conversations, since both audiences read numbers differently.
Ecommerce quarterly example: A direct-to-consumer brand generates $800,000 in net revenue over a quarter and spends $200,000 across paid social, paid search, influencer fees, and email tooling. MER = $800,000 ÷ $200,000 = 4.0×. That's a clean, textbook worked example of what the ratio looks like in practice.
Subscription note: For subscription businesses, a single-month MER can look artificially weak because you're paying full acquisition cost against only one month of revenue. Layer in a payback-window view, calculating MER against the customer's expected lifetime value over 6 to 12 months, or you'll pressure your team to cut spend on customers who are actually profitable over time.
Pro Tip: Keep a locked spreadsheet tab showing exactly which line items feed your MER calculation each period. When someone questions the number six months from now, you want to point at a formula, not reconstruct your memory.
Auditability matters more than precision here. A MER you can defend in a board meeting beats a MER that's technically more accurate but impossible to reproduce.
What Is a Good MER? Benchmarks and Setting Real Targets
Most ecommerce brands treat a blended MER between roughly 3.0× and 5.0× as healthy, but that range is a starting point, not a verdict on your business. A software company with
gross margin and a grocery delivery service with 20% gross margin should never share the same target.The real number to know is your break-even MER, and the math is simple: break-even MER = 1 ÷ gross margin. Drop below that, and every marketing dollar is a loss.
Adjust from there based on your model:
- Subscription businesses can often tolerate a lower first-month MER because retention extends the payback window across many billing cycles.
- Marketplace businesses need to net out take rates before calculating gross margin, or their break-even MER will look artificially generous.
- Product businesses with thin hardware margins usually need a higher MER than the "3 to 5" rule of thumb suggests, since one bad quarter can wipe out a year of margin.
Treat published ranges as a sanity check, then let your own gross margin set the real floor.
MER vs ROAS: What Each One Actually Measures
MER and ROAS answer different questions, and mixing them up is how marketing teams end up arguing with finance over numbers that were never meant to be compared directly. MER operates at the company level and deliberately ignores channel attribution. ROAS operates at the channel or campaign level and depends entirely on whatever attribution model that platform is using.
Use each one for a different decision:
- MER drives monthly and quarterly budget planning because it reflects what actually landed on the P&L, immune to platform-reported inflation.
- ROAS drives platform bidding and creative testing because you need channel-level feedback to know which ad set to kill this week.
- When they diverge sharply, investigate before reacting. A rising ROAS with a flat MER usually means a platform is over-crediting itself for sales that would have happened anyway, a classic sign you need an incrementality test rather than a bigger budget.
- A falling MER with strong individual ROAS numbers often points to cannibalization between channels rather than genuine new demand.
Neither metric replaces the other. MER tells you if the machine is healthy. ROAS tells you which gear needs adjusting.
Defining Inputs: What Counts as Spend and Revenue
MER is only as trustworthy as its inputs, and vague definitions are the fastest way to make the ratio meaningless across periods; for more on the importance of data hygiene in analytics, see Understanding Analytics for Better Growth.
On the spend side, include paid media across every channel, agency fees, creative production costs, influencer payments, and marketing software subscriptions. Whether you include marketing salaries is a judgment call. Some companies do, treating MER as a true cost-of-growth number; others exclude payroll to isolate media efficiency specifically. Pick one approach and document your reasoning, because it changes the number materially.
On the revenue side, gross sales, net sales (after refunds and discounts), and first-order revenue all tell different stories:
- Gross sales inflates MER and flatters underperforming campaigns.
- Net sales gives the most honest read on what actually hit the bank account.
- First-order revenue only is useful for isolating acquisition efficiency but understates businesses with strong repeat purchase behavior.
Pro Tip: Report MER monthly for trend-spotting, but review it quarterly for actual budget decisions. Monthly swings are often noise; quarterly patterns are signal.
What MER Hides and How It Can Mislead You
MER shows correlation, not causation, and that distinction gets lost the moment a number looks good on a slide. A high MER might mean your marketing is working brilliantly, or it might mean a viral moment, a competitor stumbling, or a seasonal spike carried revenue while marketing rode along for credit. Incrementality testing, whether through holdout regions or media mix modeling, is the only way to separate the two.
Common calculation mistakes compound the confusion:
- Mismatched windows, counting spend from one period against revenue recognized in another.
- Excluded costs, leaving out agency fees or tooling because they're billed separately from ad platforms.
- Vanity MER, cherry-picking a short, high-performing window and presenting it as the trend.
Seasonality is the sneakiest distortion of all. A retailer's November MER tells you almost nothing about February's marketing health, since holiday demand inflates revenue regardless of marketing quality. Compare MER year-over-year for the same period, not sequentially month to month, if your business has any seasonal pattern at all.
How to Improve Your MER: Prioritized Tactics That Work
Cutting spend is the laziest way to raise MER, and it usually just shrinks the business while the ratio looks better on paper. The tactics below actually move the number without starving growth.
- Fix retention flows first. Welcome sequences, abandoned-cart recovery, and post-purchase email or SMS flows are typically the highest-impact lever available because they generate revenue at near-zero incremental cost.
- Raise average order value. Bundles, free-shipping thresholds, and smart upsells increase the numerator without touching the denominator at all.
- Diversify channel mix. Over-reliance on one paid channel makes MER fragile to that platform's cost inflation; spreading spend across search, social, and owned channels builds resilience.
- Refresh creative on a fixed schedule. Ad fatigue quietly erodes efficiency long before anyone notices in the top-line number.
- Run incrementality tests and reallocate. Identify which channels produce genuinely incremental revenue versus which ones are just claiming credit, then shift budget toward the former, a move that reliably improves blended MER without spending an extra dollar.
- Fix the operational leaks. Slow checkout pages, confusing funnels, and clunky mobile experiences quietly tax every channel's efficiency at once.
Pro Tip: If you only have budget to fix one thing this quarter, fix retention. It compounds every other channel's performance instead of competing with them for credit.
Reallocating toward channels with proven incremental lift, rather than simply cutting the weakest-looking one, is how ROAS improvements turn into real MER gains instead of just reshuffled attribution.
Using MER for Forecasting, Budgeting, and Reporting
MER becomes genuinely useful the moment you flip the formula around for planning instead of just reporting history.
Scenario planning works the same way in reverse: if you're planning a $300,000 quarterly budget and targeting a MER of 4.0×, you need $1,200,000 in resulting revenue to hit target. Model this at your current MER, a stretch MER, and a conservative MER before finance signs off on the number.
Report MER alongside supporting metrics, never alone. A rising MER paired with a rising CAC and a shrinking LTV is not a healthy quarter, no matter how good the top-line ratio looks. Bring CAC, LTV, and ROAS into the same dashboard so leadership sees the full unit-economics picture, not just one flattering number, and use reallocation bands to keep budget shifts disciplined rather than reactive.
How Experienced Growth Leaders Actually Use MER
Practitioners who've managed real budgets treat MER as a checkpoint, not a scoreboard. The sequence that holds up across engagements:
- Lock your inputs first. Agree on revenue and spend definitions before you argue about whether the number is good or bad.
- Run a holdout test before reallocating a dollar, so you know which channels are producing incremental revenue versus riding on organic demand.
- Prioritize retention flows before touching acquisition spend, since they raise the numerator faster than almost anything else.
- Reallocate only after validation, moving budget toward channels the holdout confirmed, not the ones that simply reported the best ROAS.
This is the same sequence behind the Growth Score Calculator, built to help teams estimate unit economics and back into a defensible break-even MER before a single budget meeting happens.
The Bottom Line on MER
MER is the single most useful number for steering budget across channels, but only when the inputs stay consistent and the causation gets validated separately.
- Calculate it with locked inputs, reviewed quarterly, never redefined mid-comparison.
- Validate with an incrementality test before trusting a MER shift as real.
- Prioritize retention and AOV before cutting spend to "improve" the ratio artificially.
Why I Treat MER as a Discipline, Not a Vanity Metric
Most marketing leaders I've worked alongside discover MER the hard way, usually after a board member asks why paid media looks incredible on the platform dashboard while the bank account tells a different story. That gap is where the burn era lives, and it's exactly what MER exposes.
What I've found working across paid and owned channels is that MER only becomes trustworthy once it's tied to gross margin and validated with real incrementality testing, not just calculated and reported. Teams that skip the holdout test end up defending a number they can't actually explain when growth stalls. The ones that pair MER with unit-economics discipline turn it into a genuine operating lever, not a slide for the quarterly review. That's the approach behind the engagements documented in case studies, where blended efficiency and retention math move together instead of being reported separately.
— Asha
Ready to Turn MER Into a Real Growth Lever?
If you're comparing agencies, in-house hires, or another fractional marketer to fix your MER, the tradeoff usually comes down to one thing: most of them are strong in either paid or owned channels, rarely both. Ashafrazier builds growth systems that integrate paid media and retention together from day one, so your MER improves because the whole engine gets more efficient, not because one channel got a temporary boost while another quietly leaks money.
That's the difference between a MER that looks good for a quarter and one that compounds. Start by running the Growth Score Calculator to see your current break-even MER and unit economics, or visit Ashafrazier to book an initial consult and map out where your marketing efficiency ratio should actually be.
Sources
- Marketing efficiency ratio (MER) — HubSpot
- Why You Should Know (And Use) The Marketing Efficiency Ratio Metric — AdExchanger