
Voice of customer research (VoC) is the structured discipline of capturing what customers actually need, expect, and value, then converting those inputs into measurable requirements your teams can act on. The immediate business outcome: fewer wasted resources, faster product-market fit, and a retention engine grounded in real customer language rather than internal assumptions.
Getting there follows three steps:
- Segment and define scope. Identify which customer segment and journey stage you are studying before collecting a single data point.
- Collect across complementary channels. Combine at least two or three methods (interviews, surveys, support tickets) to balance depth with statistical breadth.
- Convert to CTQs and act. Translate recurring themes into Critical-to-Quality requirements, route them to the right owners, and close the loop with customers.
Product teams, CX leaders, marketing, and retention owners all benefit from this process. The difference between teams that get results and teams that accumulate slide decks is whether VoC feeds a system or sits in a folder.
Key Takeaways
A VoC program only compounds when it converts customer language into measurable CTQs, routes those CTQs to named owners, and closes the loop with customers within a defined SLA.
| Point | Details |
|---|---|
| Combine at least three methods | Pair a handful of interviews with a medium-sized survey and several weeks of support tickets to balance depth and breadth. |
| Translate themes to CTQs | Convert verbatims into measurable requirements (e.g., "fast responses" = initial reply within 4 business hours, 98% of tickets). |
| Close the loop within 24–48 hours | Responding to detractors quickly correlates with NPS and retention gains in documented B2B case studies. |
| Embed VoC in SIPOC | Map customer signals to process inputs and outputs so VoC drives continuous improvement, not one-off reports. |
| Ashafrazier builds the full system | End-to-end VoC program design, analysis, CTQ translation, and closed-loop governance, tied to measurable growth outcomes. |
Table of Contents
- What does voice of customer research actually mean in practice?
- Why VoC programs produce measurable business outcomes
- What methods should you use to capture VoC data?
- How do you design and run a VoC program from scratch?
- How do you analyze VoC data from raw feedback to validated themes?
- Which metrics should your VoC program track?
- How do you turn VoC insights into product and CX improvements?
- Best practices and common mistakes in VoC programs
- Sample survey questions, interview scripts, and tagging templates
- What tools do you need to run VoC at scale?
- How do you operationalize VoC inside a growth system?
- What actually separates VoC programs that work from ones that don't
- Ready to build a VoC program that actually moves the needle?
- Sources
What does voice of customer research actually mean in practice?
Voice of the customer is not simply a survey or a quarterly NPS score. It is a structured discipline that captures both stated needs (what customers explicitly ask for) and unstated needs (the friction, workarounds, and expectations they never articulate directly) and converts them into measurable requirements teams can prioritize and build against.
The ASQ definition roots VoC firmly in quality management: it is the input layer for Quality Function Deployment (QFD) and Six Sigma DMAIC cycles, where customer statements become the measurable specifications that drive process and product design. That framing matters because it positions VoC as an operational input, not a marketing exercise.
Valid VoC signals come from a wider range of sources than most teams use:
- Surveys (transactional and relational NPS, CSAT, CES)
- In-depth interviews (one-on-one discovery and exit conversations)
- Support transcripts and chat logs (unfiltered, high-volume verbatims)
- Online reviews and ratings (public, unsolicited, and often brutally honest)
- Social listening (community forums, Reddit, LinkedIn, brand mentions)
- Behavioral analytics and session recordings (what customers do, not just what they say)
- Usability tests (observed friction in real workflows)
- Passive telemetry (feature usage, drop-off points, time-to-value signals)
The stated vs. unstated distinction is where most programs leave money on the table. A customer who says "your onboarding is confusing" is stating a need. A customer who abandons setup on step three without ever submitting a ticket is expressing an unstated need. Both are valid VoC signals. A program that processes only survey responses misses the second category entirely, which is often where the highest-impact improvements live.
Why VoC programs produce measurable business outcomes
The business case for voice of the customer is not abstract. When you systematically convert customer language into prioritized requirements, the downstream effects show up in metrics that executives track.
- Lower churn. Customers who feel heard and see their feedback acted on stay longer. Forrester's CX research connects CX transformation directly to measurable retention improvements and provides benchmarking that helps set realistic targets for VoC-driven programs.
- Faster feature-market fit. Teams that build from validated customer requirements ship fewer features that nobody uses.
- Reduced rework. Engineering and operations that receive clear CTQs (rather than vague "make it better" mandates) spend less time iterating on misaligned solutions.
- Prioritized roadmap. A theme-frequency analysis of VoC data tells you which problems affect the most customers with the most intensity, which is a more defensible prioritization input than internal opinion.
- Improved onboarding. Usability tests and support ticket analysis routinely surface the exact moments where new customers stall, making onboarding fixes both targeted and fast.
- Higher NPS and CSAT. B2B case studies show that consistent feedback collection paired with rapid closed-loop responses (responding to detractors within 24–48 hours in several documented examples) correlates with meaningful NPS and retention gains.
For executives, the framing that lands is this: VoC reduces the cost of being wrong. Every product decision made without customer input is a bet. VoC does not eliminate risk, but it narrows the range of bad outcomes by replacing assumptions with evidence. That is the ROI argument worth making in a budget conversation.
Which stakeholder cares about which outcome? Product teams care about roadmap prioritization and reduced rework. CX and support leaders care about NPS, CSAT, and resolution rates. Marketing cares about customer language for positioning and messaging. Finance cares about churn reduction and CAC efficiency. A well-run VoC program produces outputs relevant to all four, which is also why it needs cross-functional sponsorship to survive.
What methods should you use to capture VoC data?
No single channel captures the full picture. Most teams that get consistent results combine at least three methods: typically 10–15 in-depth interviews, a survey targeting roughly 200 responses, and 90 days of support ticket analysis, according to operational guidance from VoC practitioners. The mix balances depth (interviews reveal the "why"), breadth (surveys give statistical confidence), and volume (tickets surface the issues customers never bother to report directly).
| Method | What it captures | Best use case | Strengths | Limits |
|---|---|---|---|---|
| NPS/CSAT survey | Relationship sentiment, loyalty signal | Relational tracking, post-transaction | Fast, scalable, benchmarkable | No root cause; response bias |
| In-depth interview | Unstated needs, mental models, context | Discovery, exit, persona building | Rich qualitative depth | Slow, small sample, analyst-dependent |
| Focus group | Group reactions, language patterns | Concept testing, messaging validation | Efficient for breadth | Groupthink risk; not for sensitive topics |
| Support tickets/chat logs | High-frequency friction, failure modes | Continuous monitoring, issue triage | High volume, unfiltered | Skewed to problems; needs NLP to scale |
| Social listening/reviews | Unsolicited sentiment, competitor gaps | Brand health, product gaps | Authentic, unprompted | Noisy; hard to attribute to specific segments |
| Usability testing | Behavioral friction, task failure | UX improvement, onboarding optimization | Observed behavior, not self-report | Lab conditions; small sample |
| Behavioral analytics | Usage patterns, drop-off, feature adoption | Product analytics, funnel optimization | Large sample, objective | No "why"; needs qualitative pairing |
| Session replay | Exact interaction paths, rage clicks | Conversion rate optimization | Granular behavioral evidence | Privacy constraints; volume management |
When to use which method depends on your program stage. Discovery calls for interviews and social listening. Validation calls for surveys and usability tests. Continuous monitoring calls for support ticket analysis, behavioral analytics, and periodic relational NPS.
Pro Tip: The most common misallocation is over-surveying high-volume channels (sending post-transaction surveys to every customer) while skipping interviews entirely. Surveys tell you what is broken at scale; interviews tell you why. Without the "why," you are optimizing in the dark. Run at least six to eight interviews before designing your first survey, so the questions reflect real customer language rather than internal hypotheses.
HBS Online's strategy guidance makes the same point: listening strategies must include both broad signal collection and targeted deep interviews for root-cause discovery. Broad without deep produces correlation without causation. Deep without broad produces anecdote without confidence.
How do you design and run a VoC program from scratch?
Implementation is where most programs stall. The planning looks clean on a slide; the execution breaks down when nobody owns the analysis, the survey goes out to the wrong segment, or the insights never reach the product team. Here is a structure that holds.
Implementation checklist
- Define scope and segment. Which customer segment, journey stage, and business question are you answering? A program without a defined question produces data without direction.
- Select your method mix. Choose 2–4 complementary methods based on your stage (discovery, validation, or continuous monitoring).
- Build your respondent plan. Identify recruitment sources (CRM, support queue, customer success list), screen for segment fit, and set minimum sample targets per method.
- Choose your tools. Survey platform, interview recording and transcription, ticket tagging, and a central repository for themes.
- Define your analysis approach. Who codes the qualitative data? What tagging taxonomy will you use? How will themes be validated?
- Set success metrics. What does a successful program produce? A prioritized CTQ list, a roadmap recommendation, a retention hypothesis to test?
Governance roles
- Sponsor. A senior leader (VP or C-suite) who owns the business question, secures budget, and ensures insights reach decision-making forums.
- Program owner. The practitioner who runs the cadence, manages vendors, and is accountable for deliverables.
- Analyst. Codes qualitative data, builds theme taxonomies, and translates verbatims into CTQs.
- Frontline contributors. Customer success, support, and sales reps who surface signals from daily interactions and validate themes against their experience.
Sample timeline: 30/60/90-day first program
- Days 1–30. Define scope, recruit respondents, conduct 10–15 interviews, run initial survey (target 200 responses), pull 90 days of support tickets.
- Days 31–60. Code all qualitative data, extract top 5–8 themes, validate with frontline contributors, build CTQ tree, present findings to sponsor.
- Days 61–90. Route CTQs to product/CX/operations owners, set SLAs for closed-loop responses, communicate changes to customers, establish recurring cadence (quarterly relational NPS, monthly ticket review, bi-annual deep interviews).
Pro Tip: Bias enters VoC programs at recruitment, not just analysis. If your respondent list comes exclusively from your most engaged customers (those who open emails, attend webinars, or have active CSM relationships), you are systematically missing the silent majority and the churned segment. Pull a stratified sample across engagement tiers, tenure, and contract size before you send a single invite.
Getting buy-in is a separate skill. The argument that works with product leaders is "this replaces assumption-driven prioritization with evidence." The argument that works with finance is "this reduces the cost of building the wrong thing." Both are true, and both are worth making explicitly.
How do you analyze VoC data from raw feedback to validated themes?
Raw VoC data is noise until it is coded. The workflow from ingestion to CTQ is repeatable once you build it, but it requires discipline at every step.
- Ingest and clean. Aggregate all data sources into a single repository. Remove duplicates, strip PII per your privacy policy, and standardize format (verbatim text, source tag, date, segment).
- First-pass affinity mapping. Read through a sample of 50–100 verbatims without coding. Group similar statements spatially (physical sticky notes or a digital tool like Miro or FigJam). The goal is pattern recognition before labeling.
- Build your tag taxonomy. Define 8–15 top-level theme tags (e.g., "onboarding friction," "pricing clarity," "support responsiveness") and 2–3 sub-tags per theme. Fewer tags produce cleaner data; more tags produce false precision.
- Code systematically. Apply tags to every verbatim. For large volumes, use NLP tools (Qualtrics Text iQ, MonkeyLearn, or similar) for first-pass tagging, then human review for ambiguous or high-stakes items. Wikipedia's VoC entry notes that modern programs use NLP to develop themes from open-ended responses, enabling near-real-time actioning, but human review remains necessary for nuanced or context-dependent language.
- Extract and name themes. Count tag frequency, weight by customer segment and revenue tier, and name the top themes in customer language (not internal jargon).
- Translate to CTQs. For each high-priority theme, build a CTQ tree: take the verbatim, map it to a quality driver, and express it as a measurable target. Example: "fast responses" becomes "initial reply within 4 business hours, 98% of tickets."
Pro Tip: Analyst drift is the silent killer of reproducible coding. Run a calibration session before full coding: have two analysts independently code the same 50 verbatims, compare results, and resolve disagreements by defining clearer tag criteria. Document those criteria in a codebook. Reproducibility is what makes your findings defensible in a product review.
Bias warnings worth building into your process: selection bias (who responded vs. who did not), recency bias (recent events dominate open-ended responses), and tipping-point effects (a single viral complaint inflates a theme's apparent frequency). Mitigate by weighting responses by segment, reviewing data over rolling periods, and cross-checking theme frequency against behavioral data before escalating.
Which metrics should your VoC program track?
Metrics give your program a scoreboard. Without them, VoC becomes a qualitative exercise that struggles to justify its budget.
| Metric | What it measures | Healthy signal | Watch for |
|---|---|---|---|
| NPS (Net Promoter Score) | Likelihood to recommend; relationship loyalty | Upward trend over rolling quarters | Single-point snapshots; response bias |
| CSAT (Customer Satisfaction Score) | Satisfaction with a specific interaction or product | Scores above segment benchmark | Varies by channel; not predictive of churn alone |
| CES (Customer Effort Score) | Ease of completing a task or resolving an issue | Declining effort scores over time | Best paired with CSAT, not used in isolation |
| Churn/retention rate | Actual customer behavior over time | Declining churn correlated with VoC actions | Lagging indicator; slow to reflect program changes |
| Sentiment score | Positive/negative/neutral ratio in text data | Improving sentiment in key theme areas | Requires consistent NLP model for comparability |
| Thematic trend frequency | How often a theme appears across periods | Declining frequency for pain themes | Needs volume normalization across periods |
| First-response time | Speed of initial support contact | Meeting SLA targets consistently | Vanity metric if resolution quality is ignored |
| Resolution rate | Percentage of issues fully resolved | Above 90% for Tier 1 issues | Needs customer confirmation, not just ticket closure |
Setting realistic baselines matters more than chasing industry benchmarks. Forrester's CX benchmarking guidance is useful for calibrating executive expectations, but your internal trend line is the number that actually tells you whether your VoC program is moving the needle. A company improving its NPS from 22 to 38 over four quarters has a story to tell, regardless of where the industry average sits.
Combine qualitative indicators with quantitative KPIs for the richest signal. A rising CSAT score paired with declining "support responsiveness" theme frequency in your ticket analysis is a confirmation signal. A rising CSAT score paired with a persistent "billing confusion" theme in interviews is a warning that your survey is not capturing the full picture.
How do you turn VoC insights into product and CX improvements?
Insights that do not move a roadmap or change a process are just documentation. The gap between "we have findings" and "we changed something" is where most VoC programs fail. Closing that gap requires a prioritization framework and a closed-loop playbook.
Prioritization: impact vs. effort
Map each validated theme against two axes: customer impact (how many customers are affected, how intensely, and what is the revenue at risk) and effort to resolve (engineering complexity, process change required, cost). Themes in the high-impact, low-effort quadrant are your immediate sprint candidates. High-impact, high-effort themes belong in the roadmap with a defined timeline. Low-impact themes go to the backlog or get closed with a communication to customers explaining the decision.
The Pain Ladder framework is a useful complement here: prioritize the themes that represent Level 3–4 pain (problems customers are actively trying to solve or that are blocking a core outcome) over Level 1–2 friction (minor annoyances that customers have adapted around).
Closed-loop playbook
- Respond. Acknowledge the feedback within 24–48 hours for detractors and high-severity issues. This alone improves retention and response rates in subsequent surveys.
- Route. Assign each validated theme to a named owner (product, CX, operations, or engineering) with a defined SLA for resolution or roadmap placement.
- Resolve. Build the fix, update the process, or make the policy change. Document the CTQ that drove the decision.
- Communicate change. Tell customers what changed and why their feedback drove it. This closes the loop visibly and increases the likelihood they will respond to future VoC requests.
Translating themes into backlog items requires specificity. "Customers want better onboarding" is not a backlog item. The CTQ is what makes the requirement testable.
Best practices and common mistakes in VoC programs
The programs that produce compounding results share a few structural habits. The ones that stall share a few structural failures.
Do these:
- Run VoC on a defined cadence, not as a one-off project. Quarterly relational surveys, monthly ticket reviews, and bi-annual deep interviews give you trend data, not just snapshots.
- Commit to closing the loop before you launch the program. If you cannot act on what you learn, do not ask. Customers who give feedback and hear nothing become your most skeptical respondents.
- Involve frontline staff (support, sales, customer success) in theme validation. They have context that no survey can capture, and their buy-in makes routing insights to action far smoother.
- Pair customer quotes with metrics when presenting findings. "Customers say onboarding is confusing" is an opinion. "Onboarding friction is the top theme in 34% of support tickets, and customers who contact support in week one churn at 2.3x the rate of those who do not" is a business case.
Avoid these:
- Treating VoC as a one-time initiative tied to a product launch or a rebrand. The signal degrades the moment you stop collecting.
- Overloading customers with surveys. Survey fatigue is real, and a 20-question post-transaction survey sent after every interaction trains customers to ignore you. Keep transactional surveys to 1–3 questions.
- Ignoring negative signals because they are uncomfortable. The most valuable VoC data is usually the most inconvenient. A pattern of "your pricing is unclear" in exit interviews is not a data quality problem; it is a positioning problem.
- Siloing findings to one team. The most common failure mode is a CX team that collects VoC data, writes a report, and never routes it to product or marketing. The data sits in a folder. Nothing changes. Customers notice.
A concrete example of the failure pattern: a SaaS company runs a post-onboarding survey, gets 400 responses, identifies "setup complexity" as the top theme, and hands the report to the CX team. The CX team adds a help article. The product team never sees the data. Six months later, the same theme appears in the next survey at the same frequency. The fix was cosmetic because the routing was broken. Governance, not analysis, was the failure.
Sample survey questions, interview scripts, and tagging templates
Transactional survey (post-interaction, 2–3 questions)
- "How easy was it to [complete this task/resolve your issue] today?" (CES scale: 1–7, Very Difficult to Very Easy)
- "What, if anything, made this harder than it should have been?" (open text)
- "How satisfied are you with the outcome of this interaction?" (CSAT scale: 1–5)
Best-practice response window: send within 2 hours of the interaction. Response rates drop sharply after 24 hours.
Relational NPS survey (quarterly, 2 questions)
- "On a scale of 0–10, how likely are you to recommend [Company] to a colleague or peer?"
- "What is the primary reason for your score?" (open text)
B2B adaptation: add a third question for account-level context: "Which role best describes you?" This lets you segment NPS by buyer vs. user vs. champion, which often reveals dramatically different scores within the same account.
Interview script template (45–60 minutes)
- Opening (5 min): "Tell me about your role and how [product/service] fits into your day-to-day work."
- Context probe (10 min): "Walk me through the last time you used [feature/process]. What were you trying to accomplish?"
- Friction probe (10 min): "Where did you get stuck or have to work around something? What did you do instead?"
- Unstated needs probe (10 min): "If you could change one thing about how [product/process] works, what would it be and why does that matter to you?"
- Outcome probe (10 min): "What does success look like for you when [task] goes well? How do you know when it has?"
- Closing (5 min): "Is there anything we have not covered that you think we should know?"
Sample tagging taxonomy
- Onboarding friction
- Pricing clarity
- Support responsiveness
- Feature gaps
- Integration reliability
- Reporting and visibility
- Contract and billing
- Performance and speed
Each top-level tag should have 2–3 sub-tags. "Support responsiveness" might break into "initial response time," "resolution quality," and "escalation handling." The taxonomy should be built from your first-pass affinity mapping, not imposed from a template, but this structure gives you a starting point.
B2C adaptation: replace "contract and billing" with "checkout and payment" and add "product quality" and "delivery experience" as top-level tags. The interview script's outcome probe works equally well in B2C; the context probe should reference the purchase or usage occasion rather than a workflow.
What tools do you need to run VoC at scale?
Technology does not replace a VoC program; it removes the manual bottlenecks that prevent one from scaling. The right stack depends on your volume, budget, and integration requirements, not on which platform has the best marketing.
Tool categories and what they do:
- Survey platforms (Qualtrics, SurveyMonkey, Typeform, Medallia): distribute surveys, collect responses, and provide basic reporting. Qualtrics and Medallia add text analytics and role-based dashboards for enterprise use.
- Text analytics and NLP (Qualtrics Text iQ, MonkeyLearn, Thematic): automate first-pass coding of open-ended responses and surface theme clusters. Useful at volumes above a few hundred verbatims per month.
- Social listening (Brandwatch, Sprout Social, Mention): monitor brand mentions, product reviews, and competitor conversations across public channels. Sprinklr's enterprise approach combines multichannel feedback, closed-loop systems, and AI analytics to detect trends in near real time, which is the direction the category is moving.
- Unified VoC platforms (Medallia, Qualtrics XM, InMoment): aggregate signals from surveys, support, social, and behavioral data into a single dashboard. Appropriate for organizations with high feedback volume and multiple collection channels.
- Session replay and behavior analytics (FullStory, Hotjar, Heap): capture how customers interact with your product or site, surfacing friction that customers never report verbally.
- Ticketing and CRM integrations (Salesforce, HubSpot, Zendesk): connect VoC data to customer records, enabling segment-level analysis and closed-loop routing within existing workflows.
Tool-selection checklist:
- Can it ingest data from all your collection channels via API or native integration?
- Does it support your tagging taxonomy and allow custom search?
- Can you set role-based access so product, CX, and marketing each see relevant views without data governance issues?
- Does it export cleanly to your BI or analytics layer (Looker, Tableau, Power BI)?
- What is the per-response or per-seat cost at your expected volume?
The integration question is often underestimated. A survey platform that does not connect to your CRM means your analysts are manually matching survey responses to customer records, which is slow, error-prone, and limits your ability to segment by revenue tier or churn risk. Prioritize integration capability over feature richness when evaluating platforms.
How do you operationalize VoC inside a growth system?
This is where VoC moves from a research exercise to a compounding business asset. The mechanism is SIPOC integration, and most teams skip it entirely.
SIPOC mapping for VoC:
- Suppliers: customers, support agents, sales reps, review platforms, behavioral analytics tools
- Inputs: verbatims, ratings, behavioral events, support tickets, interview transcripts
- Process: collection, coding, theme extraction, CTQ translation, prioritization, routing
- Outputs: CTQ specifications, prioritized backlog items, closed-loop communications, updated SLAs
- Customers: product team, CX team, engineering, marketing, executive sponsor
Embedding VoC directly into a SIPOC framework ensures customer signals become an engine for continuous improvement rather than a side project. The SIPOC makes the process auditable: you can trace any product decision back to the VoC input that justified it.
CTQ tree construction:
Take a high-frequency verbatim ("I can never find what I need in the dashboard"). Map it to a quality driver ("navigation clarity"). That CTQ goes into the sprint as an acceptance criterion, not a vague design note.
A project example: A B2B SaaS team ran a 90-day VoC sprint, combining 12 customer interviews, a 220-response NPS survey, and 3 months of support ticket analysis. The top CTQ that emerged was "reduce time-to-first-report from 11 days to 4 days." The team built that CTQ into a two-sprint onboarding redesign. Ninety days post-launch, early-tenure churn dropped by a measurable margin and NPS among customers in their first 60 days improved by 14 points. The CTQ was the bridge between customer language and engineering specification.
Action playlist for operational owners:
- Embed VoC review into your existing sprint planning or quarterly business review cadence, not as a separate meeting.
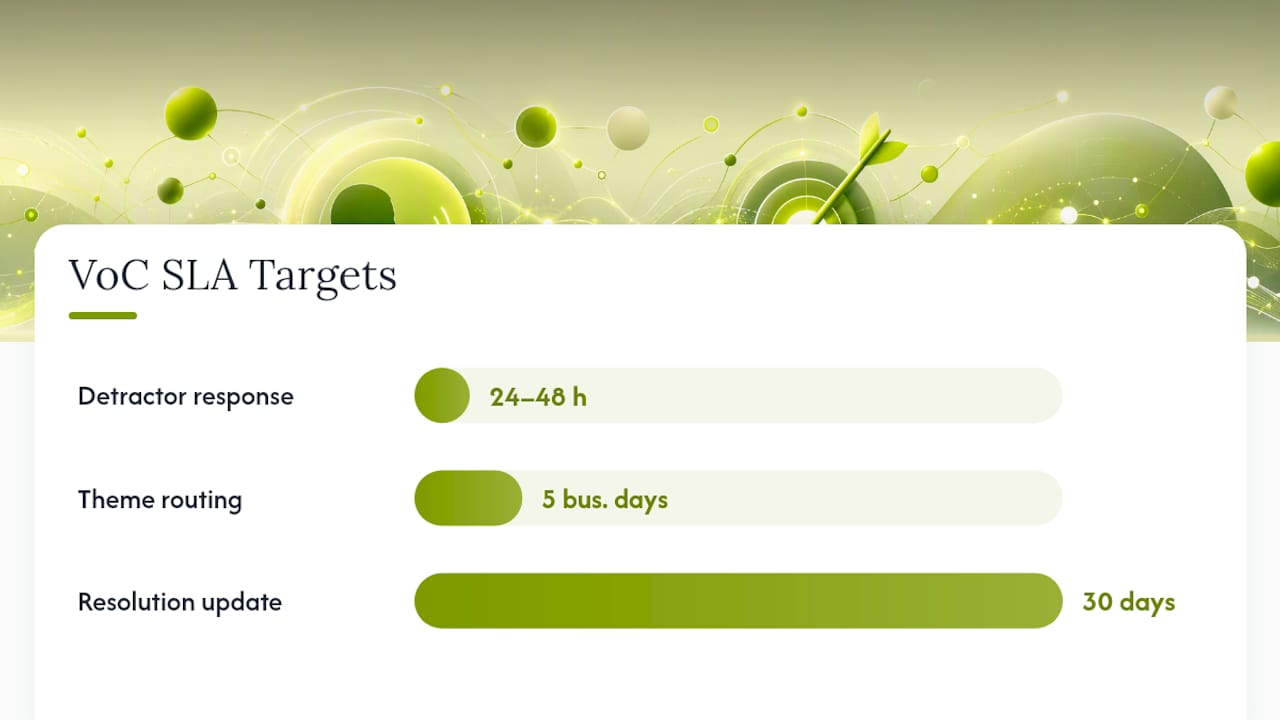
- Define SLAs for closed-loop responses: 24–48 hours for detractors, 5 business days for routing themes to owners, 30 days for a resolution update to affected customers.
- Re-evaluate your CTQ tree after each major product or process change. Customer expectations shift, and a CTQ that was accurate 12 months ago may no longer reflect the current baseline.
- Use the CAC reduction case study as a model for how fast insight-to-action cycles can materially change unit economics when VoC feeds the right growth levers.
What actually separates VoC programs that work from ones that don't
Most VoC programs fail for the same reason: the data never reaches the people with the authority to act on it. Teams collect, analyze, and present. Then the findings sit in a shared drive while the product roadmap gets built from the same internal opinions it always was. The loop never closes.
The programs that compound over time share one structural feature: they treat VoC as an operational input, not a research deliverable. The findings do not go into a report. They go into a sprint, a process change, or a customer communication within a defined SLA. That is the difference between a program that justifies its budget and one that gets cut.
There is also a subtler failure mode I see repeatedly: teams that run excellent collection and analysis but communicate findings in analyst language rather than business language. A theme frequency table means nothing to a CFO. The translation from data to business case is as important as the analysis itself.
One more thing worth saying directly: the closed-loop commitment is not optional. If you ask customers for feedback and do not act visibly, you train them to stop responding. Response rates decay, your data quality degrades, and the program becomes a vanity exercise. The 24–48 hour detractor response standard from B2B case studies is not a best practice for its own sake. It is the mechanism that keeps the feedback loop alive.
For proof points on what disciplined, insight-driven growth execution looks like in practice, the experience page covers the full range of engagements.
Ready to build a VoC program that actually moves the needle?
Most teams already have the raw material: support tickets, NPS scores, sales call recordings, churn data. What they lack is the system to convert that material into prioritized requirements and closed-loop action. That is exactly what Ashafrazier builds.
Ashafrazier's consulting covers the full VoC stack: customer discovery research, program design, qualitative and quantitative analysis, CTQ translation, prioritization frameworks, and closed-loop governance setup. The work is hands-on and tied to measurable outcomes, not a slide deck you implement alone. If you want to see what this looks like applied to a real growth system, the PartnerSlate case study shows how customer insight fed acquisition and retention improvements at scale.
To quantify the ROI potential before committing, run your numbers through the Growth Score Calculator. Or, if you are ready to talk specifics, Ashafrazier to map your current VoC gaps to a program that fits your stage and budget.
Sources
The sources below support the claims and frameworks in this guide. Each is worth consulting for deeper study in its specific area.
- Voice of the Customer (VoC): Methods and Examples
- Voice of the Customer | ASQ
- Voice of Customer Examples: 6 B2B Case Studies
- Voice of Customer Examples to Inspire You | Sprinklr
- Voice of the Customer: Strategies to Listen & Act Effectively — HBS Online
Recommended
- Lowering CAC in a B2B Marketplace: From $150 to $11 Per Brand — Asha Frazier
- The Pain Ladder: Why You Should Only Sell to Level 3-4 Pain — Asha Frazier
- Positioning Products That Are Hard to Market: How to Build Demand in a Skeptical World — Asha Frazier
- The 60-Day Turnaround: Taking a Cash-Burning DTC Brand to a $100M Exit — Asha Frazier