
Pipeline velocity equals qualified opportunities multiplied by average deal size, win rate, and divided by sales cycle length in days. The result is dollars per day. That number tells you how fast revenue is actually moving through your funnel, which is a different question than how much pipeline you have sitting in a CRM report right now.
TL;DR:
- Companies with similar pipeline totals and win rates can have drastically different velocities if their sales cycle lengths differ significantly.
- Accurate calculation requires qualified opportunities, typical deal size, closed-won win rate, and sales cycle length measured on closed deals only, with consistent lookback periods.
- Benchmark velocity ranges from under $1,000 to over $8,000 per day, depending on deal size, sales motion, and cycle efficiency, with adjustments for enterprise versus transactional sales.
- Improving pipeline velocity typically involves increasing qualified opportunities, raising average deal size, boosting win rates, or shortening sales cycles, preferably targeting high-impact, low-effort levers.
- Common CRM errors like counting unqualified deals or mixing deal sizes can distort velocity metrics, so regular data hygiene and consistent measurement are essential.
Table of Contents
- What Pipeline Velocity Measures (And Why It's a Rate, Not a Total)
- The Canonical Formula and a Worked Example
- How to Calculate Each Input Without Corrupting the Formula
- What Good Pipeline Velocity Actually Looks Like
- Tactical Levers: How to Actually Move the Number
- Common Mistakes That Quietly Break the Calculation
- A Practitioner Example and Quick Verification Checklist
- Compute Your Velocity Number in Under 30 Minutes
- Where Velocity Fits in the Revenue KPI Stack
- Fix the Inputs, Not Just the Number
- Sources
What Pipeline Velocity Measures (And Why It's a Rate, Not a Total)
Most sales dashboards report a static number: total pipeline value, or a stage-by-stage conversion breakdown. Pipeline velocity does something more useful. It converts that static total into a rate of revenue creation, measured in dollars per day, by dividing through the sales cycle length.
That division step matters more than people give it credit for. Two companies can carry identical pipeline totals and win rates, yet one closes deals in 30 days and the other in 90. Dividing by cycle length exposes that gap immediately, where a raw pipeline report would show them as equals.
Compared to the metrics most revenue teams already track, velocity does three things differently:
- It converts a lagging snapshot into a forward-looking speed indicator.
- It penalizes long, sluggish cycles even when win rates look healthy.
- It gives every input (volume, size, win rate, speed) equal weight in one number instead of burying speed in a footnote.
The Canonical Formula and a Worked Example
The standard formula sales operations teams use looks like this in plain math:
Pipeline Velocity = (Qualified Opportunities × Average Deal Size × Win Rate) ÷ Sales Cycle Length
You'll also see it written in shorthand across CRM dashboards and revenue-ops literature as:
V = (# × $ × %) ÷ L
Both notations describe the same calculation confirmed across sales performance frameworks: opportunity count, deal value, and win probability build the numerator, and cycle days shrink it into a rate.
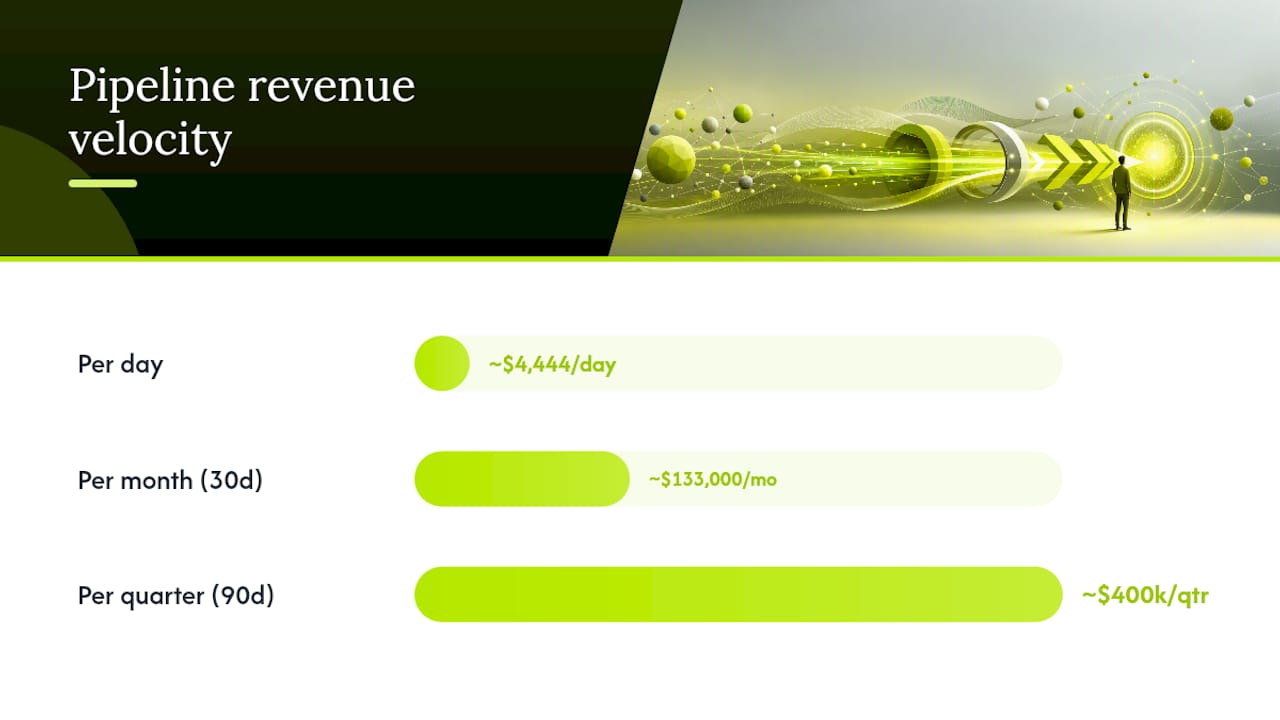
Here's how it plays out with real numbers. Say your team is carrying 40 qualified opportunities this quarter, average deal size is $20,000, your win rate runs at 25%, and the average sales cycle closes in 45 days.
- Multiply opportunities by deal size: 40 × $20,000 = $800,000.
- Multiply by win rate: $800,000 × 0.25 = $200,000.
- Divide by cycle length: $200,000 ÷ 45 = $4,444 per day.
Pipeline velocity: roughly $4,444 per day. Multiply that by 30 to get a monthly revenue projection near $133,000, or by 90 for a rolling quarterly forecast close to $400,000, assuming the four inputs hold steady.
How to Calculate Each Input Without Corrupting the Formula
The formula is simple. Getting clean inputs is where most teams quietly wreck the calculation before they even run it.
Qualified opportunities. Only count deals that have passed a defined qualification gate, not every record sitting in an open pipeline stage. If your CRM lets reps create an opportunity from a cold inbound form fill, you're counting noise. Require fields like budget confirmed, decision timeline, and identified champion before a deal counts toward the numerator.
Average deal size (ACV). Pull this from closed-won deals over a fixed lookback period, not from open pipeline, which skews toward whatever reps are currently chasing. Strip outliers, an enterprise whale or an unusually small pilot deal, before averaging, or segment by customer size so one $500,000 contract doesn't distort your mid-market number.
Win rate. The formula is closed-won divided by (closed-won plus closed-lost). Leave open, still-active opportunities out of the denominator entirely. Including them artificially inflates the rate and hides how much pipeline is actually converting.
Sales cycle length. Measure this only on closed-won deals, from the date an opportunity is created (or qualified, if you're stricter) to the date it closes. Mixing in closed-lost deals, which often drag on far longer before dying, will overstate your average cycle and understate velocity.
- Set a consistent lookback window, either a trailing 90 days or a full quarter, and never blend the two in one calculation.
- Segment every input by product line, deal size band, or ICP tier before you average across a "blended" number that hides real variance.
- Re-run the calculation on the same day each week so the lookback window doesn't drift.
Pro Tip: Build a saved CRM report that filters on your qualification criteria and closed-won status automatically, then let the four inputs populate from that single source. Manual recalculation from ad hoc exports is where most velocity numbers quietly go wrong.
What Good Pipeline Velocity Actually Looks Like
Benchmarks depend heavily on deal size and sales motion, but general 2026 bands give revenue leaders a starting reference point for mid-market B2B.
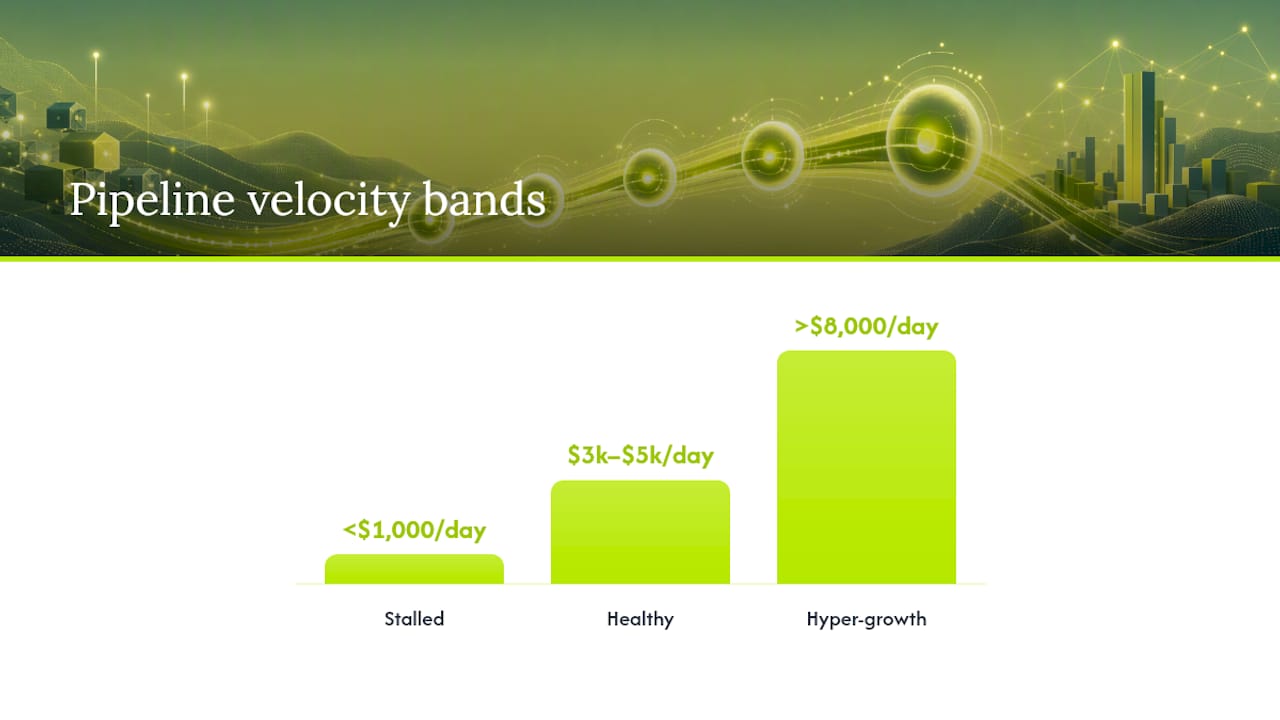
Benchmark bands (dollars per day, mid-market B2B): Stalled: under $1,000/day. Something upstream (opportunity volume or win rate) is broken. Healthy: roughly $3,000 to $5,000/day. Pipeline is converting at a sustainable pace. Hyper-growth: above $8,000/day, typically paired with an efficient, shortened cycle.
Convert your daily figure into planning terms by multiplying by 30 for a monthly view or 90 for quarterly forecasting, the same math used in the worked example above.
Two caveats change how you read these bands. High-ACV enterprise motions naturally produce lower daily velocity because cycle length stretches into months, so a $2,000/day figure might be perfectly healthy for a six-figure enterprise deal. Transactional SaaS with short cycles and win rates in the 5 to 20 percent range should expect higher daily numbers on smaller average deal sizes. Never compare velocity across fundamentally different motions without adjusting for that context first.
Tactical Levers: How to Actually Move the Number
Pipeline velocity only has four inputs, which means every improvement plan reduces to picking which lever to pull first. Here's how the plays map to each one.
- Increase qualified opportunities. Tighten SDR-to-AE handoff criteria so reps aren't inheriting unqualified noise. Align content and campaigns to the specific pain points your closed-won deals actually cite, not generic top-of-funnel messaging.
- Raise average deal size. Rebuild packaging around value-based pricing tiers instead of feature checklists, and bundle adjacent products so the entry contract starts larger. Even a modest ACV lift compounds through the entire formula.
- Improve win rate. Build a documented objections playbook from your last 20 losses, and require proof points (case studies, ROI calculators, reference calls) at a specific stage gate rather than leaving them to rep discretion.
- Shorten sales cycle length. Automate approval and procurement steps that stall deals in legal or finance review, and give sellers enablement content that answers late-stage questions before they're asked.
Prioritize with a simple impact-versus-effort grid: rank each potential test by how much it could move its input and how much work it takes to run. Start with whatever lands in the high-impact, low-effort quadrant, not whatever feels most urgent this week.
Pro Tip: Don't chase one lever in isolation. A 10% improvement across all four inputs simultaneously compounds to roughly a 46% increase in total velocity, far more than a single 40% push on just one input.
Common Mistakes That Quietly Break the Calculation
Pipeline velocity is only as trustworthy as the CRM hygiene underneath it, and a few recurring errors show up constantly in flawed calculations.
- Ghost and duplicate opportunity records inflate the count without representing real, active deals.
- Counting every created opportunity instead of only qualified ones overstates the numerator from day one.
- Switching lookback windows between calculations, 30 days one month and a full quarter the next, makes trend comparisons meaningless.
- Averaging ACV across wildly different deal sizes without segmentation lets one outlier distort the whole number.
- Letting closed-lost deals bleed into cycle-length averages inflates the denominator and understates true velocity.
- Optimizing one lever in isolation while ignoring that a drop in another input can quietly cancel the gain.
A Practitioner Example and Quick Verification Checklist
One recurring pattern from applied growth work: a B2B marketplace client was carrying healthy opportunity volume but a bloated sales cycle from manual, email-based approval chains. Automating the approval workflow and tightening qualification criteria shortened the cycle meaningfully and lifted daily velocity without adding a single rep. That kind of structural fix, documented in Asha Frazier's case study work, tends to outperform simply throwing more leads at a broken process.
| Checklist item | What to verify |
|---|---|
| Qualification gate | Fixed criteria applied consistently across reps |
| ACV segmentation | Outliers stripped, deal sizes grouped by tier |
| Win rate denominator | Only closed-won and closed-lost included |
| Cycle length basis | Closed-won deals only, consistent start event |
| Lookback window | Same window used every time you recalculate |
Compute Your Velocity Number in Under 30 Minutes
You don't need a dashboard build to get a defensible starting number today.
- Pull four fields from your CRM: qualified opportunity count, closed-won ACV, win rate, and average cycle length on closed-won deals.
- Confirm each input uses the same lookback window, either trailing 90 days or the current quarter.
- Strip outlier deals from the ACV average before calculating.
- Run the formula: multiply opportunities by ACV by win rate, then divide by cycle length.
- Multiply your daily figure by 30 or 90 to get monthly and quarterly projections.
Where Velocity Fits in the Revenue KPI Stack
Treat pipeline velocity as a weekly read for revenue leaders and a monthly deep dive for ops teams doing root-cause work, a cadence that tracks with how sales-velocity metrics get used in practice. Weekly checks catch a lever slipping before it shows up in closed revenue two months later.
Ownership matters more than most teams admit. Sales ops should own the input definitions and CRM hygiene; sales leadership owns interpreting the trend and deciding where to intervene. Velocity works best alongside forecast accuracy and activity metrics, not instead of them, because a single rate number can't tell you whether a slowdown started with lead quality or with a legal bottleneck. It tells you something is off. The other metrics tell you where.
— Asha
Fix the Inputs, Not Just the Number
Reading a velocity number is the easy part. Fixing what's dragging it down, whether that's unqualified pipeline, underpriced deals, a weak win-rate story, or a cycle bloated with approval friction, is where most internal teams stall out. Ashafrazier builds integrated paid and owned growth systems specifically to move these four levers together instead of chasing one in isolation, which is why engagements tend to produce compounding gains rather than a single quarter's bump.
If you want a fast read on where your own unit economics are leaking before you commit to a bigger fix, run your numbers through the Growth Score Calculator to see how your CAC, LTV, and payback period stack up. For a look at applied results, the case study on realreal.com walks through what happened when these levers got addressed together. Book a conversation through Ashafrazier to talk through where your pipeline is actually losing speed.
Sources
- Pipeline Velocity: Definition, Formula and 2026 Benchmarks | PipelineGrader
- Factors
- Sales Velocity: What It Is & How to Measure It | HubSpot Blog
- What is sales velocity? Meaning, formula, and report | Zendesk