
A North Star Metric is the single leading indicator that ties the core value your product delivers directly to future revenue. For most B2B SaaS companies, the right category isn't monthly recurring revenue or logo count. It's a customer-outcome or productivity metric that predicts retention and expansion before your finance team ever sees the impact.
Three signals tell you a candidate NSM is worth building a company around:
- Measurable weekly, not annually. If you can't check it every seven days, it can't guide experiments.
- Influenceable by the product team. Marketing spend shouldn't be the primary lever.
- Leading, not lagging. It should move before revenue moves, not after.
Key Takeaways
A North Star Metric works only when it's a leading, measurable, team-influenceable signal tied to customer outcomes rather than a lagging revenue number.
| Point | Details |
|---|---|
| Pick the right game first | Map your product to attention, transaction, or productivity before naming any candidate metric. |
| Favor customer outcomes | For B2B SaaS, tie the NSM to a business outcome the customer achieves, not raw usage. |
| Build 3 to 5 controllable inputs | Use breadth, depth, frequency, and efficiency to define levers your team can actually push. |
| Validate against retention | Check 6 to 12 months of cohort data before locking in a metric as official. |
| Guardrail every input | Track churn, CSAT, and misuse signals so optimization doesn't create hidden damage. |
Table of Contents
- What Is a North Star Metric in B2B, and Why Does It Matter?
- The Three Growth Games: Attention, Transaction, or Productivity?
- What Do Real B2B SaaS North Star Metrics Look Like?
- How Do You Run a Workshop to Choose Your North Star Metric?
- Which Inputs and Guardrails Actually Move the North Star?
- How Do You Build a Dashboard and Cadence Around Your NSM?
- Practical Playbook: Memo Template, Dashboard Layout, and a Real Case
- Turn Your North Star Into a Growth System
- What the Research Actually Supports About Choosing a North Star
- Sources
What Is a North Star Metric in B2B, and Why Does It Matter?
Most growth teams I've watched flounder aren't short on data. They're short on agreement about which number actually matters. That's the real function of a north star metric b2b teams rally around: it ends the debate about priorities before it starts.
When product, sales, and customer success all report to different dashboards, everyone optimizes locally and the company drifts. A shared NSM forces the same question in every meeting: does this work move the number that predicts revenue, or doesn't it? That discipline alone kills a shocking amount of busywork.
The bigger mistake is treating revenue itself as the North Star. Revenue is a lagging outcome of dozens of upstream decisions made weeks or months earlier. By the time it moves, the behavior that caused it already happened. Amplitude's North Star framework makes this explicit: the metric should tie customer value to revenue while still functioning as an early warning system, not a rearview mirror.
Teams with a clear NSM also run more experiments, because they stop arguing about what "success" means for every test. One Amplitude analysis found that structuring a metric around 3 to 5 controllable inputs gives teams a direct target to push instead of guessing at revenue drivers indirectly.
Here's what changes once a team commits to one NSM:
- Roadmap debates shift from opinion to evidence.
- Experiment backlogs get prioritized by expected NSM lift, not internal politics.
- Cross-functional standups stop rehashing "what are we even optimizing for."
The Three Growth Games: Attention, Transaction, or Productivity?
Before you pick a metric, pick a game. This is the step almost everyone skips, and it's why so many B2B teams end up with an NSM copied from a company whose business model looks nothing like theirs.
- The attention game. Products that win by capturing and holding usage time, like media or social platforms. Rarely the right frame for B2B software, where more time in-app often signals friction, not value.
- The transaction game. Products that win when a specific action gets completed, like a marketplace closing a deal or a payments platform processing a transfer. Fits B2B tools where a discrete event (a signed contract, a completed transfer) is the value moment.
- The productivity game. Products that win when customers accomplish more with less effort, like project management or CRM tools. This is where most B2B SaaS actually lives.
Once you know your game, map your product's core value moment to it and shortlist 2 to 3 candidate metrics. Test each candidate against a simple question: does this number go up specifically because customers got more value, or could it go up for reasons unrelated to value (like a pricing change or a sales push)?
The most common failure I see is a team lifting Slack's or HubSpot's public NSM and assuming it will translate. It won't, because their pricing motion, sales cycle, and product complexity are different from yours. Copying the metric without copying the underlying game logic just gives you a number that looks impressive in board decks and tells you nothing useful.
Pro Tip: Run the "so what" test on any candidate metric. If the number moves and nobody on the leadership team can say what customer behavior caused it, it's not a North Star. It's vanity dressed up as strategy.
What Do Real B2B SaaS North Star Metrics Look Like?
Public examples are useful for pattern recognition, not for copy-paste adoption. Here's how six well-known B2B companies structure their core metric, and what it signals about the customer value underneath.

Intercom has leaned toward metrics tied to resolved customer conversations, because the product's value is measured in support outcomes delivered, not messages sent. A support team that resolves more conversations per agent is extracting real productivity gain.
Shopify tracks active merchants, because the entire business model depends on merchant survival and growth, not just merchant signups. A merchant who churns in month two never generates the transaction volume Shopify actually monetizes.
HubSpot has framed its NSM around weekly active teams rather than individual logins, according to Growth Academy's compilation of tech company North Star examples. Team-level activity correlates with account expansion far better than any single seat's usage does.
Slack historically tracked messages sent within a team, a transaction-style metric that captures whether the product actually replaced email as the primary communication channel.
Salesforce ties its value to CRM records actively updated and used in pipeline decisions, not just records created. A stale record sitting unused signals adoption failure even if the account looks "active" on paper.
Asana has tracked weekly active subscribers tied to task completion, again reflecting Growth Academy's data on how B2B companies tie NSMs to the core business entity, whether that's a team, a merchant, or a record, rather than a generic activity count.
A North Star must link to revenue, reflect customer value, and stay measurable enough that every department can see how its own work moves the number. That's the standard Mixpanel sets, and it's a stricter bar than most companies apply before they lock in a metric.
The caution here is real: none of these companies validated their metric by guessing. Each one almost certainly ran correlation analysis against retention and expansion before making it official. If you adopt a metric shape without doing that same validation work, you've imported someone else's business model assumptions into yours.
How Do You Run a Workshop to Choose Your North Star Metric?
You can pick a defensible NSM in a single focused session if you invite the right people and follow a tight agenda. Skip this structure and you'll get a metric chosen by whoever argues loudest.
Who to invite: a product lead, a growth or marketing lead, a customer success lead (they see churn signals before anyone), a sales lead (they know what buyers actually value), and one executive sponsor who can break ties and commit resources afterward. Five to seven people, no more. Larger groups produce consensus mush.
Here's the agenda that works:
- Draft candidates (15 minutes). Each person writes 2 to 3 candidate metrics independently before any discussion, to avoid anchoring on the first idea spoken aloud.
- Map to customer value (20 minutes). For each candidate, state in one sentence what customer behavior it captures and why that behavior predicts them staying and expanding.
- Assess measurability (15 minutes). Can you pull this number weekly, today, from existing data? If it requires new instrumentation, flag it but don't disqualify it.
- Identify inputs (20 minutes). For the top 2 to 3 candidates, list 3 to 5 inputs the team can directly influence that would move the metric.
- Vote and commit (10 minutes). Use dot voting weighted by role, weight the CS and product votes higher, since they're closest to the value moment.
- Validation and ownership (10 minutes). Assign a single owner and set a 30/60/90-day plan: 30 days to instrument tracking, 60 days to run the first input experiments, 90 days to check correlation against early retention data.
Before you finalize anything, run one data check: pull 6 to 12 months of cohort history and see whether movement in your candidate metric actually preceded renewal or expansion. Amplitude's guidance suggests that if your candidate metric's movement explains a meaningful share of the variance in cohort renewal, you've found a strong NSM. If it explains almost none of it, go back to step one.
Pro Tip: Don't let the workshop end without a named owner. A North Star Metric with no accountable person attached becomes a slide in a deck nobody revisits.
Which Inputs and Guardrails Actually Move the North Star?
Your NSM sits on top of a handful of input metrics your team can directly push. Pick these using a breadth, depth, frequency, and efficiency lens, a heuristic Growth Method outlines as the practical translation layer between a lofty North Star and the daily work of product and growth teams.
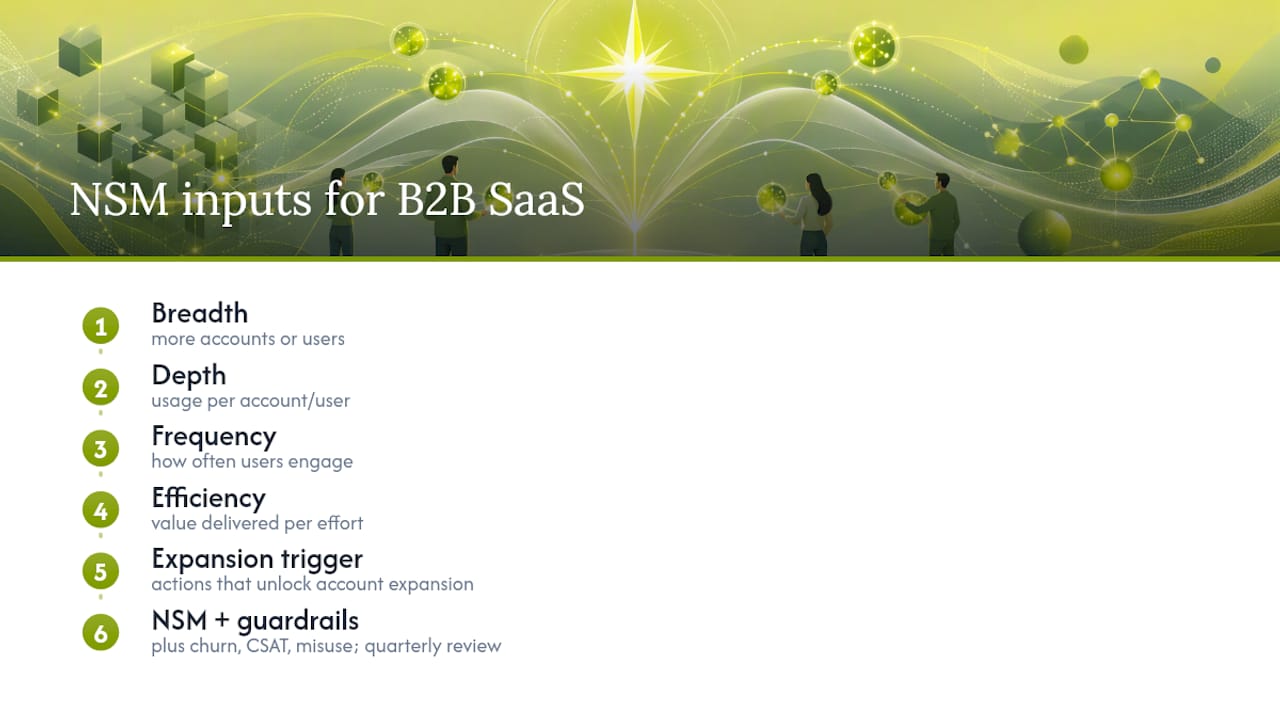
For a subscription B2B product, a reasonable input set often includes breadth, depth, frequency, efficiency, and an expansion trigger that teams can influence
Inputs need to report fast enough to act on. Growth Method's guidance is blunt about this: annual or quarterly signals are useless as NSM inputs, because by the time you see the number move, the quarter that caused it is already over.
Guardrails matter just as much as inputs, because an NSM without a counterweight invites its own kind of damage. If you optimize purely for depth of use, you can accidentally reward feature bloat or workflow complexity that frustrates users. Track churn rate, CSAT, and any signal of feature misuse (like customers gaming an activation metric without deriving real value) alongside your inputs. Composite success metrics that blend multiple signals can be powerful, but research on optimization design warns they require real guardrail discipline to avoid rewarding the wrong behavior. A retention-focused review of your NSM's downstream health is worth doing quarterly, not just at launch.
How Do You Build a Dashboard and Cadence Around Your NSM?
A North Star Metric that lives in a slide deck is decoration. It has to live in a dashboard your team checks the way they check email.
Dashboard essentials: segment your NSM by customer size, plan tier, and acquisition channel, because a metric that looks flat in aggregate often hides a segment that's cratering while another masks it. Layer cohorts so you can see whether new customers are hitting the same milestones faster or slower than customers from six months ago. Put leading inputs on the same view as the lagging NSM, so the team can see cause and effect without switching tools.
Experiment workflow: every test targeting an input metric should have a stated hypothesis about how it moves the NSM, a guardrail metric it must not damage, and a rollout rule (what percentage of traffic, for how long, before a decision gets made). Teams that skip the guardrail step tend to ship wins that quietly increase churn a quarter later.
Cadence that actually works:
- Weekly: a 15-minute signal review, inputs and NSM movement, no slides.
- Monthly: a deeper dive into one segment or cohort showing unexpected movement.
- Quarterly: an executive synthesis connecting NSM trend to unit economics like CAC payback and LTV.
The teams that get this right are the ones who guard the weekly meeting fiercely and refuse to let it turn into a 45-minute status update.
Practical Playbook: Memo Template, Dashboard Layout, and a Real Case
You don't need a consultant to formalize any of this. You need a concise document and the discipline to fill it in honestly.
- The one-page NSM memo. Fields: the metric definition, the customer value it represents, the 3 to 5 inputs, the guardrails, the owner, and the 90-day validation result. If a field is blank, the metric isn't ready to launch.
- The dashboard layout. Weekly view: NSM trend, top 3 inputs, one guardrail alert. Monthly view: cohort breakdown by signup month and plan tier, segment comparison, input correlation check. Keep the weekly view to a single screen. If it scrolls, nobody reads it.
- A real case note. In one B2B marketplace engagement, instrumented dashboards and input-focused testing helped drop CAC from $150 to $11 per brand, largely by exposing which onboarding steps correlated with actual retention instead of vanity signups.
Pro Tip: Build the dashboard before you finalize the metric definition. Trying to instrument a metric after committing to it in a board deck is how teams end up reporting numbers they can't actually trust.
Turn Your North Star Into a Growth System
Choosing the right metric is the easy part compared to building the paid and owned channel systems that actually move it. That's the gap where most growth teams stall, they have a north star metric b2b leadership finally agrees on, but no integrated system connecting acquisition spend, onboarding, and retention to that number.
That's the work Asha Frazier does with companies directly: building growth systems that combine paid media and owned channels so the inputs feeding your North Star Metric compound instead of resetting every quarter. If you want a second opinion on whether your current metric setup actually predicts revenue, Asha Frazier's growth consulting is built around exactly that diagnosis. For a faster gut check on where your unit economics stand today, the Growth Score Calculator estimates your LTV, CAC, and payback period in a few minutes.
What the Research Actually Supports About Choosing a North Star
The conventional advice on North Star Metrics treats it as a naming exercise, pick one number, put it on a dashboard, done. That's backwards. The metric is the least important part of the process. The game you choose and the inputs you commit to testing are what actually change outcomes.
Most B2B teams also overweight public examples. Knowing that Shopify tracks active merchants tells you almost nothing about what your own retention curve responds to. The workshop and validation step, checking whether your candidate metric's movement actually precedes renewal, is the part everyone skips because it's slower than picking a number in a meeting.
If you take one thing from this: build the dashboard and run the correlation check before you announce the metric company-wide. A North Star that hasn't been tested against your own retention data is just a guess wearing a strategic label.
— Asha
Sources
- Every Product Needs a North Star Metric: Here’s How to Find Yours — Amplitude
- What is a North Star metric? — Mixpanel
- North Star Metric: Definition, Framework & Examples — Growth Method
Recommended
- The Essential Growth Marketing KPIs: Building a Dashboard That Drives Decisions — Asha Frazier
- The Complete Guide to LTV:CAC Ratio: What It Is, Why It Matters, and How to Improve It — Asha Frazier
- Lowering CAC in a B2B Marketplace: From $150 to $11 Per Brand — Asha Frazier
- The Boring Science of Scaling: How to Engineer Predictable Revenue from Seed to $100M+ — Asha Frazier