
Incrementality testing measures the conversions your marketing actually caused versus what would have happened without it. Run one when you are spending meaningfully on upper-funnel channels, launching into a new channel, or when a CFO is questioning whether your branded search budget is buying customers or just taxing organic traffic. The feasibility check is arithmetic: if you cannot generate a sufficient number of total conversions across your test and control groups during the test window, then a valid platform lift test is not feasible at standard confidence levels.
Table of Contents
- What incrementality testing measures and how it differs from attribution
- When is incrementality testing worth the cost?
- How to design an incrementality test that produces credible results
- Which statistical methods and tools should you use?
- How to operationalize incrementality testing across your stack
- How to read test outputs and turn them into budget decisions
- Common failure modes and how to avoid them
- An anonymized case: how one test changed a $2M channel budget
- 8-step playbook to run an incrementality test
- Key Takeaways
- The measurement stack most founders are missing
- What Ashafrazier does differently for growth teams running incrementality tests
- Primary sources and recommended further reading
What incrementality testing measures and how it differs from attribution
Attribution allocates credit across existing conversions. Incrementality testing isolates net-new conversions your marketing caused. That distinction is the difference between a CFO trusting your numbers and cutting your budget.
Standard attribution, including last-click and even data-driven models, assigns credit to any touchpoint in a journey, including conversions that would have happened organically. A customer who was going to buy anyway gets "credited" to the retargeting ad they saw on the way. The platform reports a strong ROAS. You scale the channel. You are lighting capital on fire.
The classic example: a retailer sees high conversion volume from branded search ads. An incrementality test reveals that 80% of those conversions would have occurred through organic search regardless. The real incremental value is 20% of what the platform reported. That is not a rounding error; it is a budget reallocation decision.
- Attribution answers: which touchpoints were present when a conversion occurred?
- Incrementality answers: did the marketing cause the conversion, or would it have happened anyway?
- The gap between those two answers is where misallocation lives.
Marketing leaders treat causal lift measurement as the gold standard for justifying top-of-funnel budgets precisely because attribution systematically undervalues brand and awareness channels while overvaluing retargeting and branded search.
When is incrementality testing worth the cost?
Not every channel or budget level warrants a formal test. Prioritize when the business decision would change materially if the true incremental lift is meaningfully lower than what attribution reports.
| Use Case | Why Test | Minimum Signal Needed |
|---|---|---|
| New channel validation | No historical baseline; attribution blind | — |
| Brand / TV / streaming | Attribution cannot track view-through causally | Geo or time-series design |
| Retail media accountability | Retailer-reported ROAS often inflated | Geo holdout or panel |
| Branded search cannibalization | Organic would capture most demand | — |
| Promotional lift | Isolate promo effect from baseline demand | Pre/post or holdout |
| Large product launch | Establish causal baseline before scaling | Geo or BSTS |
Adoption of incrementality testing has accelerated due to privacy-driven tracking loss and retail media accountability pressure, yet many teams still face tooling gaps and accuracy concerns. The feasibility rule is simple: check your conversion volume and your minimum detectable effect (MDE) before designing anything. If the business decision would not change at a 15% lift, you do not need a test sensitive enough to detect 5%.
How to design an incrementality test that produces credible results
Choose randomized user-level holdouts when you can. Use geo or synthetic methods when you cannot. That rule covers 90% of design decisions.

For user-level holdouts, the sample-size arithmetic follows a clear formula: conversions required per group ≈ 15.68 ÷ (relative lift)². Detecting a 20% lift requires roughly 392 conversions per group; detecting a 10% lift requires roughly 1,568 per group. Detecting a 5% lift requires over 6,000 per group, which is why chasing small effects is expensive and slow.
Pro Tip: Set your MDE before you design the test, not after. If you need 15,700 total conversions to detect a 10% lift with a 10% holdout, and your channel drives 500 conversions per month, you are looking at a multi-year test. Either widen the holdout, accept a larger MDE, or use a geo design.
Key design decisions:
- Holdout size: 10–20% is typical; larger holdouts increase power but reduce revenue during the test window.
- Test duration: Long enough to capture a full purchase cycle, usually 4–8 weeks minimum.
- Contamination controls: Prevent audience leakage by using mutually exclusive user IDs or geographies; channel overlap (a user in both a Facebook and Google holdout) invalidates both tests.
- Pre-registration: Document your hypothesis, KPIs, decision thresholds, and analysis plan before the test starts. Changing these after you see results is p-hacking.
For geo holdouts, test and control markets must match on baseline conversion rate, population size, and seasonality. Badly matched markets produce false positives that look like lift but are just baseline variance.
Running a holdout costs you short-term revenue from the control group. That cost is the price of knowing whether your channel is building the machine or just running the meter.
Which statistical methods and tools should you use?
Randomized A/B holdouts are the gold standard. When randomization is impossible, Bayesian structural time-series (BSTS) models, implemented via CausalImpact, are the most credible alternative.
| Method | Best For | Strengths | Weaknesses | Time to Result |
|---|---|---|---|---|
| Randomized user holdout | Digital channels with user IDs | Clean causal inference | Requires volume; holdout cost | 4–8 weeks |
| Geo holdout | TV, OOH, broad launches | Privacy-safe; no user tracking | Market matching complexity | 4–8 weeks |
| CausalImpact / BSTS | TV, streaming, geo launches | Handles no-randomization cases | Requires long pre-period; assumptions | 2–4 weeks post-launch |
| Synthetic control | Policy-like interventions | Transparent counterfactual | Data-intensive; slow | 4–12 weeks |
| Difference-in-differences | Before/after with control group | Simple; interpretable | Parallel trends assumption | Varies |
CausalImpact constructs a Bayesian structural time-series model using pre-period trends, seasonality, and control covariates to forecast what would have happened without the intervention. The critical assumption: control time series must not themselves be affected by the intervention. Poor pre-period fit, measured by RMSE, invalidates the counterfactual entirely.
The pre-period should be at least three times the length of the post-period. A four-week campaign needs at least twelve weeks of clean pre-period data. Google has also lowered budget minimums for Bayesian lift analyses, making platform-native tools more accessible for smaller budgets, though platform lift tools like Meta Conversion Lift and Google Ads experiments limit customization and scope to platform-reported impressions.
The right stack for most growth teams: platform lift tools for quick directional reads, CausalImpact for TV and geo launches, and randomized holdouts for high-volume digital channels. Combine all three with marketing mix modeling (MMM) to get both granular causal estimates and portfolio-level budget curves.
How to operationalize incrementality testing across your stack
- Audit your tagging and event definitions. Every conversion event must fire consistently across both groups. Deduplication and identity resolution must be locked before the test starts, not patched afterward.
- Define attribution windows explicitly. A 7-day click window and a 28-day view window produce different denominators. Standardize before you randomize.
- Pre-register the hypothesis and decision rule. Write down: "If incremental ROAS exceeds X, we scale. If it falls below Y, we cut." Get stakeholder sign-off before the test runs.
- Implement privacy-safe holdout design. Use hashed first-party IDs for user-level holdouts. Geo holdouts are inherently privacy-safe and require no user-level tracking, which makes them CCPA/CPRA-compliant by design.
- Bring data engineering, legal, and finance in early. Legal needs to review holdout consent implications; finance needs to budget the holdout revenue cost as a measurement investment.
How to read test outputs and turn them into budget decisions
Report lift with confidence intervals and a plain-language business interpretation. A result of "+18% incremental conversions (95% CI: +9% to +27%)" is a budget decision. A result of "+3% (95% CI: -4% to +10%)" is a re-test signal, not a scale signal.
The most dangerous result is a wide confidence interval that crosses zero. It does not mean the channel does not work. It means you do not have enough data to know yet. Report the upper bound as the best-case scenario and use it to set the minimum volume needed before the next test.
The decision framework:
- Observed lift well above MDE, CI excludes zero: Scale the channel.
- Observed lift near MDE, CI includes zero: Maintain current spend; re-test with more volume.
- Observed lift below MDE or negative: Cut or reallocate; investigate cannibalization.
- Null result with tight CI: Informative. Report the upper bound as the channel's ceiling.
Key metrics to report in every test: incremental conversions, incremental revenue, incremental ROAS, incremental LTV, and the full confidence or credible interval on each. Feeding these outputs as Bayesian priors into your MMM anchors the model to causal ground truth and prevents correlation artifacts from distorting portfolio-level budget recommendations.
Common failure modes and how to avoid them
- Underpowered tests: The single most common mistake. Run the sample-size math before committing to a design.
- Contamination: Audience leakage between test and control groups inflates apparent lift. Use mutually exclusive assignment and monitor for overlap.
- Structural breaks: A competitor promotion, a supply shock, or a platform algorithm change during the test window invalidates results. Document external events and run sensitivity checks.
- Poor pre-period fit in BSTS: If the model cannot predict the pre-period accurately, the counterfactual is unreliable. Check RMSE before interpreting post-period lift.
- Mis-specified controls in CausalImpact: Control time series that were themselves affected by the intervention produce false lift estimates. Plot all covariates and run a placebo test on an imaginary pre-period intervention.
- Changing the hypothesis after seeing results: Pre-registration exists for this reason. Post-hoc hypothesis changes destroy the statistical validity of the test.
For geo holdouts specifically, badly matched markets are the primary source of false results. Use matched-market selection algorithms or manual matching on at least three baseline dimensions before assigning treatment.
An anonymized case: how one test changed a $2M channel budget
A direct-to-consumer brand was allocating roughly $2M annually to retargeting, with platform-reported ROAS of 6x. Attribution looked strong. The CFO was skeptical. A randomized user-level holdout ran for six weeks, withholding retargeting from 15% of the eligible audience.
The result: incremental ROAS of 1.8x (95% CI: 1.2x to 2.4x), with roughly 70% of attributed conversions occurring in the holdout group at the same rate. The channel was capturing demand, not creating it. The team reallocated 60% of that budget to upper-funnel channels, where a subsequent geo holdout confirmed a 22% incremental lift in new customer acquisition.
The test did not kill the channel. It killed the illusion that the channel was doing more than it was. That distinction is worth millions in compounded budget efficiency.
Asha's documented growth outcomes across high-consideration markets reflect exactly this pattern: measurement-driven reallocation, not gut-driven scaling, is what produces durable ROAS.
8-step playbook to run an incrementality test
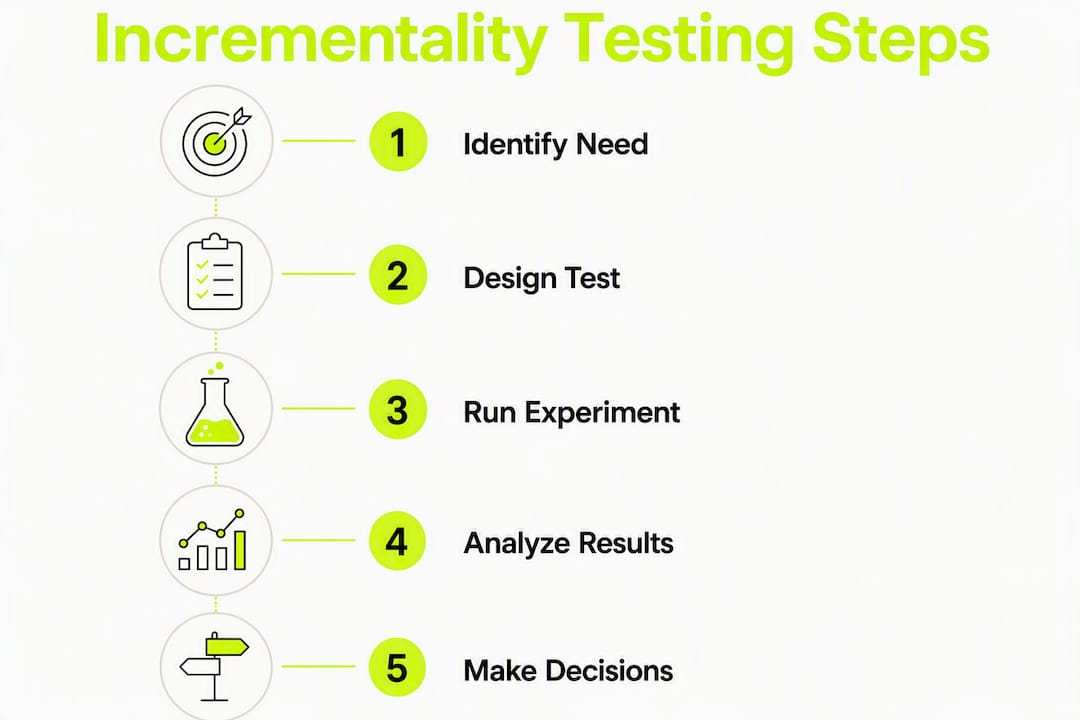
- Feasibility check (Day 1–3): Calculate monthly conversions per channel. Apply the MDE formula. If volume is insufficient, choose geo or BSTS design.
- Hypothesis and decision rule (Day 3–5): Write the pre-registered hypothesis, KPIs, and the exact thresholds that will trigger scale, maintain, or cut decisions.
- Test design (Day 5–10): Choose user holdout, geo holdout, or synthetic control. Size the holdout. Select and validate control markets or control time series.
- Instrumentation (Day 10–14): Audit tagging, deduplication, and identity resolution. Lock attribution windows. Get legal and finance sign-off.
- Randomization or market matching (Day 14–21): Assign treatment and control groups. Run a pre-period sanity check to confirm baseline parity.
- Run the test (Weeks 3–10): Monitor for contamination and structural breaks. Do not peek at results for statistical decisions until the pre-registered end date.
- Analyze (Week 10–11): Calculate incremental lift with confidence intervals. Run sensitivity checks. Compare to MMM estimates.
- Act (Week 11–12): Apply the pre-registered decision rule. Feed lift estimates as priors into MMM. Brief finance and leadership with the business interpretation, not just the statistics.
Total elapsed time: 8–12 weeks for a well-powered digital holdout; 12–20 weeks for a geo or BSTS test requiring a long pre-period.
Key Takeaways
Incrementality testing is the only measurement method that proves causation, and without it, most attribution-based budget decisions are educated guesses dressed up as data.
| Point | Details |
|---|---|
| Feasibility is arithmetic | Under 784 total conversions (392 per group), a standard platform lift test is underpowered; check volume before designing. |
| Holdout cost is an investment | Withholding ads from the control group has a short-term revenue cost; budget it as measurement, not waste. |
| CausalImpact when you cannot randomize | BSTS requires a pre-period at least three times the post-period length and controls unaffected by the intervention. |
| Report lift with intervals | A result without a confidence interval is not a decision; always report the full range, including null upper bounds. |
| Ashafrazier integrates tests into budget decisions | Ashafrazier's consulting practice connects test design, MMM calibration, and budget activation into one growth system. |
The measurement stack most founders are missing
Most founders I advise are not running incrementality tests because they think they lack the budget or the volume. The real barrier is usually the absence of a pre-registered decision framework. Without one, a test result is just a number. With one, it is a budget authorization.
The measurement stack that actually compounds is three layers: attribution for granular campaign visibility, incrementality testing for causal ground truth on key channels, and MMM for portfolio-level budget curves. Each layer answers a different question. Attribution tells you what happened. Incrementality tells you what you caused. MMM tells you where the next dollar should go. Running only one of the three is like navigating with one instrument.
My advice on cadence: run one to two incrementality tests per quarter, focused on the channels where the business decision is most contested. Use geo holdouts for TV and streaming, where justifying brand awareness spend to a skeptical board requires causal evidence, not correlation. Use user-level holdouts for high-volume digital channels. Feed every result into your MMM as a prior.
On the in-house versus external question: the design and governance work is where most teams fail, not the analysis. A consultant who has run dozens of these tests will pre-register the right hypothesis, catch contamination before it invalidates the test, and translate the output into a budget decision your CFO will accept.
What Ashafrazier does differently for growth teams running incrementality tests
Most consultants hand you a framework. Ashafrazier builds the measurement system, runs the test, and sits in the budget meeting to defend the reallocation decision. The work spans test design, instrumentation, analysis, and the stakeholder conversation that turns a lift estimate into a capital decision.
For founders and growth executives who need causal proof before moving budget, Ashafrazier's integrated approach connects incrementality testing to your MMM, your attribution stack, and your owned-channel programs. The result is not a report. It is a growth system where every dollar is allocated to channels that demonstrably create demand, not just capture it. If you are ready to build that system, start here or use the growth score calculator to model where your next incremental dollar should go.
Primary sources and recommended further reading
- CausalImpact R package documentation — Start here for implementing BSTS-based counterfactual analysis; best for technical teams building in-house workflows.
- Google research on BSTS and causal inference — The Brodersen et al. Annals of Applied Statistics paper; use this for governance and finance conversations that require peer-reviewed methodology.
- Soku incrementality testing guide — Practical sample-size arithmetic and holdout design; best for teams sizing their first test.
- MetricGate synthetic baseline difference documentation — Pre-period diagnostics and control selection for CausalImpact workflows; essential for avoiding the most common BSTS failure modes.
- Google Think with Google on incrementality — Executive-level rationale for causal measurement; use this in stakeholder alignment conversations.
- EMARKETER incrementality FAQ — Market context on adoption barriers and tooling gaps; useful for benchmarking your team's maturity.
- HyperFX incrementality overview — Platform lift tool comparison (Meta Conversion Lift, Google Ads experiments) and accessibility improvements from Bayesian budget minimums.