
The four fastest levers to increase ROAS are measurement hygiene, pausing wasted spend, fixing message match between your ad and your landing page, and refreshing creative cadence. Get those four right in the next 72 hours and you will see your portfolio efficiency shift before you touch a single bid strategy.
Here is the immediate action list:
- Verify your attribution window. Confirm every channel reports on the same window (7-day click or 14-day click/1-day view). Mismatched windows inflate platform ROAS and hide your real number.
- Run a waste pass. Pull every placement, keyword, and ad set with meaningful spend but zero conversions in the last 14 days. Pause them now. That capital is lighting itself on fire.
- Fix message match. Your ad headline should mirror the exact offer on the landing page. If the ad says "50% off running shoes" and the page opens on a generic homepage, you are paying for clicks you cannot convert.
- Rotate one fresh creative per major ad set. On Meta and Google Display, creative fatigue on social platforms typically appears within 14 to 21 days. Swap in one new concept per ad set before you touch budgets.
Pro Tip: Recompute ROAS on a consistent attribution window before drawing any conclusions. Use a single 7 to 14-day window across all channels, or run your numbers through the Growth Score Calculator to translate LTV and CAC into a target you can actually defend to leadership.
These four moves work because they remove the noise that masks your real return on ad spend. Measurement reveals what is actually happening. Pausing waste immediately raises portfolio efficiency without touching a single winning campaign. Message match lifts conversion rate on existing traffic, which has the same proportional ROAS impact as cutting your cost per click. Creative rotation prevents the slow bleed of fatigue from eroding a campaign that was working fine three weeks ago.
Key Takeaways
Increasing ROAS requires fixing measurement and post-click experience before touching bids, then compounding improvements across creative, offer, and audience in a disciplined sequence.
| Point | Details |
|---|---|
| Fix measurement first | Consistent attribution windows and server-side tracking reveal your real ROAS before any optimization begins. |
| Break-even ROAS anchors targets | Calculate break-even ROAS from gross margin, then set target ROAS at 1.5–2x that number based on growth priorities. |
| Landing page CRO equals CPC reduction | A 1% conversion rate improvement has the same proportional ROAS impact as a 1% reduction in cost per click. |
| Use MER to gate budget decisions | Reconcile blended MER with platform ROAS monthly; never scale spend when MER is declining. |
| Ashafrazier sequences the system | Ashafrazier's framework applies measurement, post-click, and creative production gates in order, producing an average 7x ROAS across engagements. |
Table of Contents
- How to calculate ROAS and break-even ROAS
- How to set ROAS targets that reflect your actual margins
- What are the highest-impact tactics to increase ROAS?
- How to fix measurement before you optimize anything
- Your 30-day and 90-day ROAS improvement plan
- Common ROAS optimization mistakes and when to stop chasing efficiency
- Asha Frazier's ROAS framework and proven results
- The principles I follow when improving ROAS
- Ashafrazier builds the ROAS systems that compound
- Sources
How to calculate ROAS and break-even ROAS
ROAS (return on ad spend) is the ratio of revenue attributed to ads divided by the cost of those ads.
ROAS = Revenue from Ads / Ad Spend
Simple enough.
That is where break-even ROAS comes in.
Break-even ROAS = 1 / Gross Margin %
For a simple ROAS calculation: spend $500, generate $1,000 in revenue, and you have a 2x ROAS.
Worked example for two businesses:
The SaaS example adds a layer: even at a profitable ROAS, if your customer acquisition cost (CAC) is not recovered within a reasonable payback window, you are funding growth with capital you do not have. That is why break-even ROAS and target ROAS must be anchored to unit economics, not industry averages.
Platform ROAS vs. blended ROAS (MER)
Platform-reported ROAS and blended ROAS (also called Marketing Efficiency Ratio, or MER) measure different things and serve different decisions.
| Metric | What it measures | Best used for |
|---|---|---|
| Platform ROAS | Revenue attributed to one channel's ads / that channel's spend | Weekly campaign-level optimization |
| Blended ROAS / MER | Total revenue / total ad spend across all channels | Monthly budget gating and profitability decisions |
Platform ROAS is inflated by view-through attribution, modeled conversions, and cross-channel overlap. MER strips all of that out. MER is the more reliable metric for business-level planning, while ROAS is the right tool for deciding which campaigns to scale or cut within a channel.
How to set ROAS targets that reflect your actual margins
Setting a target ROAS without anchoring it to unit economics is one of the most common ways teams end up optimizing toward a number that feels good but destroys margin.
The correct sequence: calculate break-even ROAS from gross margin, then set your target ROAS as a multiplier of that break-even based on your growth versus profitability priority.
Which you choose depends on whether you are in a growth phase (accept lower margin to acquire customers) or a profitability phase (hold the line).
When customer lifetime value (LTV) is high relative to first-order margin, you can afford to accept a lower first-purchase ROAS because the economics recover over time. A subscription business with a 24-month LTV can rationally run a first-order ROAS below break-even if payback lands within 90 days. A single-purchase commodity business cannot. For a deeper look at how LTV and CAC interact with these targets, the LTV:CAC ratio guide walks through the mechanics in full.
Pro Tip: Reconcile platform ROAS with blended MER every month before you approve a budget increase. If MER is declining while platform ROAS holds steady, you have a cannibalization or attribution problem, not a growth signal. Check the 2026 growth marketing benchmarks to calibrate your MER expectations by stage and channel mix.
Benchmarks by business stage are directional, not prescriptive. Channel mix matters: Google Search tends to report higher ROAS than Meta prospecting because it captures existing demand rather than creating it.
What are the highest-impact tactics to increase ROAS?
Systematic testing across three or more ROAS levers produces faster improvement than single-variable focus. The five layers below compound on each other, which is why sequencing matters as much as the tactics themselves.
Layer 1: Audience targeting
Wasted audience reach is one of the fastest ways to bleed ROAS without knowing it.
- Seed lookalike audiences from your top-LTV customers, not all buyers. A lookalike built from your top 10% by LTV will outperform one built from all purchasers.
- Add exclusion lists: existing customers (for prospecting campaigns), low-intent placements (Audience Network on Meta, certain Display placements on Google), and geographic segments with consistently poor conversion rates.
- Segment by intent stage. Retargeting audiences should run on tighter ROAS targets than cold prospecting because the economics are fundamentally different.
Layer 2: Creative testing
Creative is the highest-variance lever in paid social and the one most teams under-invest in systematically.

Test in this sequence: concept first (what is the core message or angle?), then format (UGC vs. polished video vs. static image), then execution details (headline copy, CTA, color). Declare a winner only after a variant has accumulated roughly 50 conversions, not after 48 hours of impressions. Declaring winners too early is one of the most expensive mistakes in paid media.
On Meta specifically, creative fatigue tends to appear within a few weeks. Build a production system that generates 20 to 50 new creatives per month at scale, not a one-off refresh every quarter.
Layer 3: Landing page and CRO
A 1% improvement in landing page conversion rate has the same proportional ROAS impact as a 1% reduction in cost per click. That parity is why landing page work is a durable lever while CPC reductions are often temporary and competitive.
Priority fixes:
- Message match: the ad's primary claim should appear verbatim or near-verbatim in the landing page headline. Every degree of mismatch costs you conversion rate.
- Page speed: target a Largest Contentful Paint (LCP) under 2.5 seconds. Slow pages kill mobile conversion rates, and mobile is where most paid social traffic lands.
- Trust signals: reviews, guarantees, and social proof placed above the fold reduce friction for first-time buyers.
- AOV lifts: bundle offers, order bumps, and upsells on the post-purchase page raise revenue per transaction without increasing ad spend.
Layer 4: Offer engineering
The offer is the most underrated ROAS lever because it affects revenue per transaction directly. Subscription incentives (first-order discount for subscribe-and-save) improve LTV, which changes the economics of your target ROAS entirely.
Layer 5: Bidding and budget
Move to value-based bidding (Target ROAS or Maximize Conversion Value in Google Ads, Value Optimization in Meta Ads) only after your conversion volume is sufficient to feed the algorithm. Google Ads generally needs 30 to 50 conversions per month per campaign before smart bidding performs reliably.
Budget ramp rules matter. Larger jumps reset the learning phase and can crater performance for 7 to 14 days. Scale horizontally into new audiences or campaigns rather than vertically stacking spend on a single ad set.
| Tactic | Expected ROAS lift | Time to see results | Risk to scale |
|---|---|---|---|
| Pause wasted spend | Immediate portfolio efficiency gain | 24–72 hours | Low |
| Message match fix | Moderate conversion rate improvement | 1–2 weeks | Low |
| Creative refresh (fatigue) | Preserves existing ROAS baseline | 1–3 weeks | Low |
| Landing page CRO | Durable, proportional to CVR gain | 2–4 weeks | Low |
| Audience exclusions | Reduces wasted impressions | 1–2 weeks | Low |
| Value-based bidding | Significant when data is sufficient | 4 weeks | Medium |
| Offer/AOV engineering | High when executed well | 2–6 weeks | Medium |
| Lookalike from top LTV | Improves prospecting efficiency | 3–6 weeks | Medium |
How to fix measurement before you optimize anything
Every optimization decision is only as good as the data behind it. Bad measurement does not just give you wrong numbers. It causes you to scale campaigns that are losing money and cut campaigns that are working.
The correct diagnostic order is: verify measurement first, inspect the post-click path second, remove wasted spend third, then iterate on creative, audience, and bidding.
Measurement validation checklist:
- Confirm attribution windows are consistent across all channels (Google Ads, Meta Ads, and any retargeting platforms like Criteo).
- Audit UTM parameters: every paid URL should carry source, medium, campaign, and content tags. Missing UTMs mean GA4 misattributes sessions to direct or organic.
- Check conversion event definitions. Are you firing on gross revenue or net revenue? Gross revenue inflates ROAS if you have high return rates.
- Reconcile platform-reported conversions against your commerce platform (Shopify, Stripe, or your CRM) weekly. A gap larger than 10–15% signals a tracking problem.
- Verify that GA4 is receiving purchase events with correct revenue values. Use the GA4 DebugView to confirm event parameters are passing correctly.
Implementation priorities:
- Server-side tagging / Conversion API (CAPI): browser-based pixels lose signal to iOS privacy changes and ad blockers. Implementing Meta's Conversions API and Google's server-side tagging via Google Tag Manager recovers lost conversion data. AppsFlyer is the standard for mobile app attribution and provides a clean, deduplicated signal across networks.
- Blended MER as north star: calculate total revenue divided by total ad spend monthly. Use this number to gate budget decisions. If MER drops below your break-even threshold, hold spend until you diagnose the cause.
- Incrementality testing: run a geo holdout or a conversion lift test (available in Meta Ads Manager and Google Ads) to measure true incremental ROAS, not just attributed ROAS. Even a simple 10% holdout on a retargeting campaign will reveal whether that campaign is driving new revenue or just claiming credit for purchases that would have happened anyway.
Your 30-day and 90-day ROAS improvement plan
The fastest way to waste a good playbook is to execute everything at once. Sequencing is the discipline that separates teams that compound improvements from teams that spin their wheels.
Day 0 audit (complete before anything else):
- Pull a 30-day spend report by campaign and ad set. Flag every campaign with spend but no conversions.
- Check attribution window consistency across all active channels.
- Review the top five landing pages by paid traffic. Score each on message match and page speed.
- Audit creative age: flag any ad creative running for more than 21 days on Meta or more than 30 days on Google Display.
- Check budget distribution against the 70/20/10 framework. Most accounts are inverted, with too much in testing and not enough in proven campaigns.
30-day plan:
| Action | Primary metric | Target improvement |
|---|---|---|
| Pause wasted spend | Portfolio ROAS | Immediate lift |
| Fix message match on top 3 landing pages | Conversion rate | Measurable within 2 weeks |
| Rotate fresh creative in fatigued ad sets | CTR and CVR | Stabilize within 1–3 weeks |
| Implement UTM hygiene and GA4 event audit | Attribution accuracy | Resolved within 1 week |
| Reconcile platform ROAS vs. MER | MER baseline | Established within 2 weeks |
90-day plan:
- Build a creative testing cadence: minimum two new concepts per month per channel, tested to 50 conversions per variant before declaring a winner.
- Launch one offer experiment: a bundle, an order bump, or a subscribe-and-save incentive. Measure AOV lift and its effect on ROAS.
- Implement server-side tracking (CAPI for Meta, server-side GTM for Google). This is a 2 to 4-week engineering project but recovers signal that directly improves smart bidding performance.
- Run one incrementality test: a geo holdout on your top retargeting campaign. The result will either validate your attributed ROAS or reveal that you are over-crediting a channel.
- Optimize portfolio allocation using the 70/20/10 framework. Shift budget from underperforming test campaigns to proven converters.
- Transition top campaigns to value-based bidding once conversion volume supports it (30 to 50 conversions per month per campaign minimum).
For a concrete kill-list format to run the first 30 days, the First 30 Days: Audit, Cut, Optimize, Explore framework maps this sequence into a week-by-week checklist.
Common ROAS optimization mistakes and when to stop chasing efficiency
Most ROAS problems are not bidding problems. They are measurement problems, offer problems, or post-click problems wearing a bidding costume.
Mistakes that destroy ROAS without looking like mistakes:
- Optimizing ROAS without reconciling MER. Platform ROAS can hold steady or even rise while blended MER deteriorates, because channels are cannibalizing each other or claiming credit for organic conversions. Always check both.
- Cutting prospecting too aggressively. Retargeting campaigns report high ROAS because they target warm audiences. Cutting prospecting to chase that number starves the top of the funnel and collapses retargeting performance 60 to 90 days later.
- Declaring creative winners too early. A creative with 15 conversions is not a winner. It is a hypothesis. Calling it early and scaling it wastes budget on a false signal.
- Ignoring post-click friction. If your landing page loads in 5 seconds on mobile, no amount of bid optimization will fix your ROAS. The post-click experience is where most ROAS problems actually live.
- Scaling too fast. Budget increases above 20% per day reset the learning phase in Google Ads and Meta Ads. The algorithm needs time to recalibrate. Patience here is not timidity; it is discipline.
Decision rules for trade-offs:
- Accept lower ROAS when you are building a new audience segment that will feed retargeting pools. The prospecting ROAS will look poor; the downstream retargeting ROAS will look excellent. Evaluate the combined portfolio, not each campaign in isolation.
- Hold budget when MER signals trouble, even if individual campaign ROAS looks healthy. MER is the honest number.
- Prioritize LTV over short-term ROAS when your payback window is under 90 days and your retention data supports it. A customer worth $500 over 18 months justifies a first-order ROAS that looks thin on paper.
Platform ROAS inflation is real. View-through attribution, modeled conversions, and cross-device matching all add noise. Treat platform ROAS as a directional signal, not a ground truth, and always reconcile against your commerce data.
Asha Frazier's ROAS framework and proven results
The framework that consistently produces compounding ROAS improvement has three gates: measurement, post-click, and creative production. You do not move to the next gate until the previous one is solid.
Gate 1: Measurement. Confirm that what you are measuring is real. Server-side tracking, consistent attribution windows, and MER reconciliation are not optional steps. They are the foundation. Without them, every optimization decision is a guess.
Gate 2: Post-click. Fix the path from click to conversion before you touch bids or budgets. Message match, page speed, and trust signals are the three highest-leverage variables. Most accounts have at least one of these broken.

Gate 3: Creative production. Treat creative as a manufacturing system, not a one-time project. The accounts that sustain strong ROAS over time are the ones with a repeatable process for generating, testing, and rotating creative at volume.
This sequencing matters because skipping gates is how teams end up in the reactive loop: they cut a campaign, launch a new one, see a short-term lift, then watch performance deteriorate again because the underlying measurement or post-click problems were never fixed.
Applied results from this framework include reducing CAC in a B2B marketplace from $150 to $11 and achieving an average ROAS of 7x across engagements in high-consideration markets. The DTC 60-day turnaround case shows what happens when measurement, post-click, and creative production are fixed in sequence under time pressure.
The Growth Score Calculator translates your LTV, CAC, and payback period into a target ROAS and a prioritized sequence of work. It is the fastest way to move from "our ROAS is too low" to "here is the specific lever we fix first."
Average ROAS of 7x across engagements in high-consideration markets, where trust and timely execution determine whether growth compounds or stalls.
The principles I follow when improving ROAS
Most ROAS problems are discipline problems. The math is not complicated. The hard part is not making reactive decisions when a campaign dips for three days.
Here are the operating rules I apply consistently:
- Verify measurement before touching anything else. If the data is wrong, every optimization move is wrong. This step is never optional, even when the client is impatient.
- Fix post-click before fixing bids. A landing page that converts at 1.5% will not become a 4% converter because you switched to Target ROAS bidding. Fix the page first.
- Treat creative as a production system. At scale, 20 to 50 new creatives per month is not aggressive; it is the minimum needed to stay ahead of fatigue and maintain a testing pipeline.
- Never increase budget more than 20% per day. This is not a guideline. It is a hard rule. Larger jumps reset learning phases and introduce variance that looks like a strategy problem when it is actually a pacing problem.
- Use the 70/20/10 budget split. Seventy percent to proven campaigns, twenty percent to testing new audiences or creatives, ten percent to experimental concepts. Inverted accounts, where most budget sits in testing, are the norm. They should not be.
- Scale horizontally, not vertically. When a campaign is working, the instinct is to pour more budget into it. The smarter move is to duplicate it into a new audience segment. Vertical scaling on a single audience accelerates fatigue and raises CPMs. Horizontal scaling preserves efficiency.
Pro Tip: When a campaign hits its ROAS target consistently for two weeks, resist the urge to double the budget. Instead, clone it into a new lookalike segment seeded from your top-LTV customers. You get incremental volume without disrupting the original campaign's learning.
Ashafrazier builds the ROAS systems that compound
Most advertisers are one diagnostic away from a meaningful ROAS improvement. The problem is not that the levers do not exist. It is that teams lack the sequencing, the measurement infrastructure, and the creative production system to pull them in the right order.
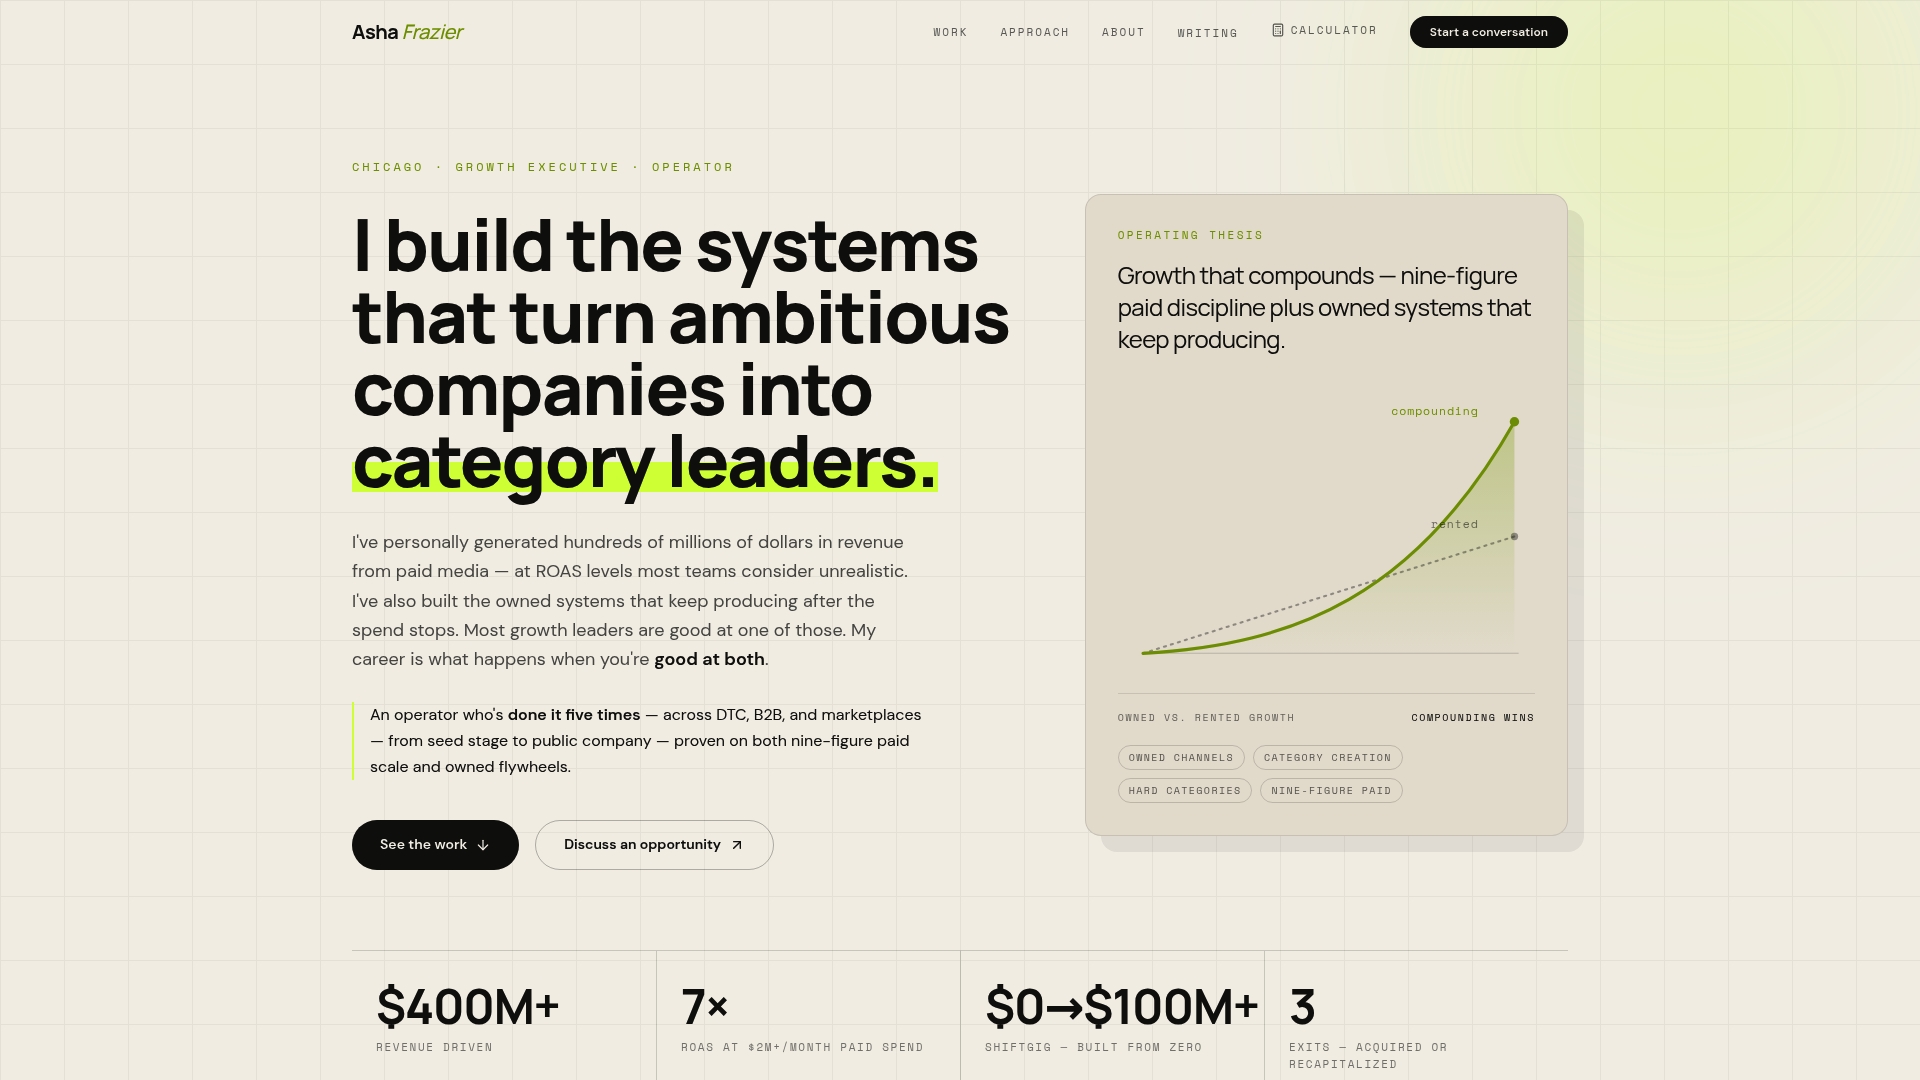
Ashafrazier works with founders and growth executives to build exactly that: a full growth system that integrates paid media, offer engineering, landing page optimization, and attribution setup into a compounding machine. Engagements include a prioritized diagnostic in the first week, a 30/90-day execution plan, and hands-on implementation across measurement, creative, and conversion rate optimization.
Start by running your numbers through the Growth Score Calculator to translate your LTV and CAC into a target ROAS and a sequenced work plan. If the output confirms you need more than a calculator, book a discovery call to discuss a fractional CMO or growth consulting engagement.
Sources
- ROAS Optimization: Strategies to Improve Return on Ad Spend
- How to Increase ROAS: Your 2026 Playbook | AdStellar
- Facebook ROAS optimization — Databox