
Brand lift measurement is the causal test that quantifies how advertising changed what people think, feel, or intend to do about your brand. It works by comparing survey responses from an exposed group (people who saw your ads) against a control group (people who were eligible but did not), then attributing the difference to the campaign. The core metrics are awareness, ad recall, brand familiarity, favorability, consideration, and purchase intent. Before you run a single survey, pick the one metric that maps directly to your campaign objective, set a detectable-lift threshold, and build a sample-size plan around it. That discipline separates studies that drive decisions from studies that produce noise. Named tools like Google Brand Lift and third-party panels like Dynata and Ipsos each offer different coverage and cost structures, but the underlying logic of absolute lift and relative lift is the same across all of them.
Table of Contents
- What does brand lift measurement actually tell you?
- Core brand-lift metrics and how to write survey questions that work
- How lift is calculated and what the statistics actually mean
- How to run a brand lift study from setup to reporting
- Measurement best practices and the pitfalls that quietly kill studies
- How to interpret lift results and what counts as meaningful
- Connecting brand lift to business outcomes and dashboards
- How brand lift fits into multi-touch attribution models
- Using brand lift insights to sharpen creative and targeting
- Frequency effects and diminishing returns in brand lift
- Survey-based lift vs implicit measures: what each method actually captures
- How lift measurement differs across digital video, social, and TV
- Key Takeaways
- What most teams get wrong about brand lift
- Measurement frameworks that translate lift into growth decisions
- Useful sources and further reading
What does brand lift measurement actually tell you?
Clicks and conversions tell you what people did. Brand lift measurement tells you what shifted in their minds. Those are different questions, and conflating them is one of the more expensive mistakes in campaign evaluation.
Technically, brand lift measures the causal change in brand perceptions attributable to ad exposure, not just correlated with it. The exposed-vs-control design is what makes it causal rather than observational. Brand lift studies isolate whether advertising changed perception by comparing exposed and unexposed audiences, and they are campaign-specific and time-bound, often running across 2–4 week windows.
The relationship with performance metrics is complementary, not competitive. A campaign can drive strong click-through rates while failing to move brand favorability, which matters enormously in high-consideration categories where the purchase cycle is long. Conversely, a brand campaign can shift awareness by eight percentage points without generating a single attributable conversion in the same window. Both data points are true and both are useful. The mistake is treating one as a proxy for the other.
Choose a lift study when your campaign objective is perception-level change: launching a new brand, repositioning an existing one, entering a new audience segment, or defending share of mind against a competitor. Rely on behavioral signals alone when the objective is direct response and the conversion window is short enough to measure cleanly.
Core brand-lift metrics and how to write survey questions that work
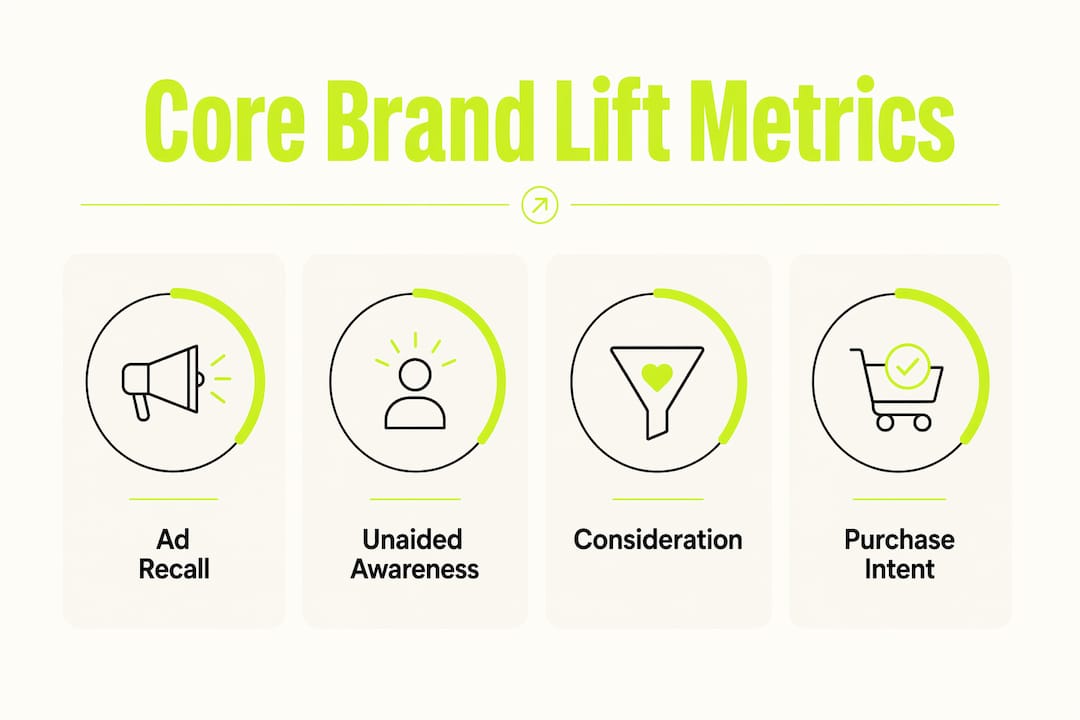
No single metric captures the full picture. Brand lift metrics commonly include awareness (aided and unaided), ad recall, brand familiarity, favorability, consideration, and purchase intent, and each one answers a different campaign question.
- Unaided brand awareness: "When you think of [category], which brands come to mind?" Captures top-of-mind presence without prompting. The gap between unaided and aided scores is a practical diagnostic for mental availability: a large gap signals an opportunity to improve spontaneous recall.
- Aided brand awareness: "Have you heard of [Brand X]?" Measures recognition when the brand name is provided. Useful for newer brands with low baseline presence.
- Ad recall: "In the past week, have you seen or heard an advertisement for [Brand X]?" Tests whether the creative registered and linked back to the brand.
- Brand familiarity: "How familiar are you with [Brand X] and what it offers?" Moves beyond recognition to depth of understanding.
- Brand favorability: "How favorable is your overall impression of [Brand X]?" Evaluates emotional response and message tone.
- Consideration: "How likely are you to consider [Brand X] the next time you need [category]?" Bridges perception and purchase behavior.
- Purchase intent: "How likely are you to purchase from [Brand X] in the next 30 days?" The closest perception metric to a conversion signal.
- Message association: "Which of the following words or phrases do you associate with [Brand X]?" Tests whether the campaign's core message landed.
Pro Tip: Pick one primary KPI before the campaign launches, tied directly to the campaign's funnel stage. Treat every other metric as secondary diagnostic data. Studies that try to optimize for awareness, favorability, and purchase intent simultaneously often end up underpowered on all three.
Awareness campaigns should anchor on unaided awareness or ad recall. Consideration campaigns should anchor on consideration or favorability. Intent-stage campaigns should anchor on purchase intent. The secondary metrics still get reported, but they do not drive the pass/fail judgment on the campaign.
How lift is calculated and what the statistics actually mean
The arithmetic is straightforward. Absolute lift is the raw percentage-point difference in positive responses between the exposed group and the control group. Relative lift divides that absolute change by the control group's baseline to express the gain as a percentage increase.

| Metric | Exposed group | Control group | Absolute lift | Relative lift |
|---|---|---|---|---|
| Ad recall | — | 34% | +8 pts | — |
| Consideration | — | — | +5 pts | — |
| Purchase intent | — | — | +3 pts | — |
An +8 percentage-point lift in awareness indicates a statistically significant positive shift attributable to the campaign, and study reports typically include confidence levels alongside that figure. Relative lift adds context: a +3-point absolute gain on a 6% baseline (50% relative lift) is a very different result than a +3-point gain on a 60% baseline (5% relative lift). Both numbers matter.
Statistical significance is what separates a real signal from random variation. Most platforms and panels report at the 90% or 95% confidence level, meaning there is at most a 5–10% probability the observed lift occurred by chance. Margin of error shrinks as sample size grows, which is why sample planning is not optional.
Google Brand Lift may require roughly 2,000 responses per lift metric for detection, and thresholds can rise significantly in some configurations, creating real challenges for small budgets or narrow B2B audiences. Before committing spend to a platform-native study, calculate the expected detectable lift at your likely response volume. An underpowered study does not return a null result because nothing happened. It returns a null result because you did not have enough data to see what happened.
How to run a brand lift study from setup to reporting
Running a valid lift study requires discipline at every stage. Cutting corners on randomization or survey timing produces results that cannot be trusted, regardless of how clean the creative was.
- Define the objective and primary KPI. Decide what funnel stage the campaign targets and which single metric will determine success before anything else is set.
- Set a detectable-lift threshold. Determine the minimum lift that would be meaningful for your business. This drives the sample-size requirement.
- Plan your sample size. Work backward from the detectable-lift threshold and your expected baseline to calculate the minimum responses needed per group. Platform-native tools have eligibility calculators; use them before launch.
- Establish the control group. The control group should be drawn from the same eligible audience pool as the exposed group, randomized at the user level, and verified to remain unexposed throughout the flight. Control-group contamination via cross-device exposure or imperfect segmentation is the most common methodological error in lift studies.
- Choose your measurement approach. Platform-native tools (YouTube/Google, Meta, Amazon) are convenient and often free above spend minimums, but they are limited to their own inventory and require meeting eligibility thresholds. Third-party panels like Pollfish, Attest, or SurveyMonkey Audience let you sample non-customers across channels, which is preferable when the objective is measuring awareness in a broader target market rather than an existing customer base. On-site or in-app surveys risk sampling only existing customers and should be used only when that population is the explicit target.
- Design the survey. Lead with the primary KPI question, follow with secondary metrics, and keep the total survey under five questions to minimize fatigue. Use consistent question wording across waves to enable comparison over time.
- Set the field period. Studies are best run during or immediately after a campaign so recall remains fresh. Most platform-native studies run for 3–14 days; third-party panels often require 1–3 months for sufficient exposure and response volume.
- Validate the control post-study. Check control-group recall rates. Unexpectedly high recall in the control is a red flag for contamination and should trigger a review of exposure logic before you accept any conclusions.
Measurement best practices and the pitfalls that quietly kill studies
The most common failure mode is not a bad survey. It is a study designed after the campaign brief was already locked, with no sample plan, no pre-specified detectable-lift threshold, and a control group that was never verified.
Best-practice rules to build in from the start:
- Define the single primary KPI before the campaign launches, not after results come in.
- Set the detectable-lift threshold and minimum sample size before committing budget.
- Align the audience targeting in the study with the audience the campaign actually reached.
- Pair lift results with behavioral signals (branded search volume, direct traffic) to validate whether perception shifts are translating downstream.
- Use a lift study for causal attribution of a specific flight, and pair it with an always-on tracking program to capture slow-moving equity shifts that a single study will miss.
A brand lift study is not a replacement for continuous brand tracking. Lift is campaign-specific and time-bound; tracking monitors long-term equity trends through repeated survey waves. Using lift studies alone to infer long-term brand health produces noisy, short-term snapshots that miss the slow-moving shifts that actually determine category position.
Pro Tip: If your control group shows unusually high ad recall, do not accept the null result at face value. Run a cross-device exposure check first. Contaminated controls systematically underestimate campaign impact and have killed more than a few campaigns that were actually working.
Common pitfalls to watch for: small sample sizes that leave the study underpowered; over-segmentation that fragments responses below significance thresholds; survey fatigue from questionnaires that run too long; and misinterpreting a non-significant result as proof the campaign had no effect. A null result means the study could not detect a difference at the specified confidence level. It does not mean no difference exists.
How to interpret lift results and what counts as meaningful
Interpreting lift requires context. The same absolute number means different things depending on the baseline.
- +3–5 percentage points is generally considered measurable progress for digital campaigns, particularly for brands with moderate baseline awareness.
- +8 percentage points or more is considered strong in many digital campaign contexts, though this depends heavily on category, audience size, and baseline.
- A brand at 12% unaided awareness has substantial headroom to move. A brand at 60% awareness has far less room, so even a +2-point gain at that baseline can represent meaningful incremental reach.
Benchmarks are context-dependent, and practitioners should treat industry benchmarks as orientation, not verdict. The more useful comparison is your own prior studies, which is why maintaining a consistent measurement cadence builds compounding value over time.
Confidence intervals tell you the range within which the true lift likely falls. A result of +6 points with a 95% confidence interval of +2 to +10 is directionally positive but imprecise. A result of +6 points with a 95% confidence interval of +5 to +7 is precise and actionable. When the confidence interval crosses zero, the result is not statistically significant at that level, but it may still provide directional insight worth acting on cautiously, particularly if the study was underpowered due to budget constraints.
A non-significant result with a consistent directional positive trend across multiple metrics is worth noting. It is not a green light to declare success, but it is a signal to rerun the study with a larger sample before writing off the campaign.
Connecting brand lift to business outcomes and dashboards
Lift numbers sitting in a platform dashboard do not drive decisions. The workflow that makes them useful is: run the lift study, validate the result against behavioral signals, then model the downstream business impact.

Branded search volume is the most accessible behavioral leading indicator. It is free via Google Search Console, updates near real time, and tends to move in response to brand campaigns before direct traffic or revenue does. A +5-point lift in consideration that coincides with a 15% increase in branded search queries is a much stronger signal than either data point alone.
Consolidating lift outputs with behavioral metrics into a single dashboard creates more actionable insight than lift numbers alone, because it lets teams see whether perception shifts are correlating with immediate downstream behaviors that predict revenue changes.
| Dashboard component | Source | Update cadence |
|---|---|---|
| Absolute and relative lift by metric | Platform or panel report | Per study |
| Branded search volume index | Google Search Console | Weekly |
| Direct traffic trend | Web analytics | Weekly |
| Social mentions and sentiment | Social listening tool | Weekly |
| Downstream conversion rate | CRM or attribution platform | Monthly |
For a simple ROI translation: if a campaign produces a +5-point lift in consideration among an audience of 500,000 people, that represents 25,000 incremental people who now consider the brand. Apply a conservative conversion rate from consideration to purchase (say, 2%) and an average order value, and you have a rough estimate of incremental revenue attributable to the perception shift. The assumptions are explicit and conservative, which is exactly how you present this to a CFO. For a more rigorous LTV and CAC model, that incremental consideration figure feeds directly into payback period calculations.
How brand lift fits into multi-touch attribution models
Multi-touch attribution (MTA) models distribute conversion credit across touchpoints in a customer journey. Brand lift measurement answers a different question: did the campaign change perception, regardless of whether a conversion was tracked? The two are complementary, and the gap between them is where most measurement programs fall short.
The practical integration point is the upper funnel. MTA models typically undervalue brand-building touchpoints because they assign credit based on proximity to conversion, which disadvantages awareness-stage impressions that influenced a purchase weeks or months later. Brand lift data provides the causal evidence that those upper-funnel touchpoints moved the needle on awareness and consideration, even when MTA assigns them minimal credit.
The workflow: run lift studies on brand campaigns, document the metric shifts, then overlay those shifts against the MTA model's touchpoint-credit distribution. Where lift is high but MTA credit is low, you have evidence that the model is undervaluing that channel. That evidence supports budget reallocation arguments that pure attribution data cannot make on its own. Building this into a growth marketing dashboard is what separates teams that optimize on evidence from teams that optimize on assumption.
Using brand lift insights to sharpen creative and targeting
Lift data at the creative and audience-segment level is one of the most underused inputs in campaign optimization. Most teams look at aggregate lift and stop there. The more valuable analysis is the disaggregated view.
If a campaign shows strong ad recall but weak message association, the creative registered but the brand link did not land. That is a creative brief problem, not a media problem. If lift is strong among 25–34-year-olds but flat among 45–54-year-olds, the targeting or the creative is misaligned with the older segment. Both diagnoses require lift data broken out by creative variant and audience segment, which is why study design should include those breakouts from the start.
Platforms like Amazon Brand Lift allow results to be analyzed by audience segment, frequency, ad type, and device, which gives creative teams the signal they need to iterate. The principle applies across platforms: design the study to answer the optimization questions you will actually face, not just the headline pass/fail question.
Frequency effects and diminishing returns in brand lift
Ad frequency has a nonlinear relationship with brand lift. Early exposures tend to produce the steepest gains in awareness and recall. As frequency increases, incremental lift per additional exposure declines, and at high enough frequencies, favorability can actually decrease as the audience experiences ad fatigue.
Dynata's frequency analysis in brand lift reporting helps advertisers identify how many ad exposures drive the strongest brand response. That optimal frequency point varies by category, creative format, and audience familiarity with the brand. A new brand entering a category typically benefits from higher frequency before diminishing returns set in. An established brand with high baseline awareness hits diminishing returns faster.
The practical implication: if your lift study includes frequency breakouts and you see flat or declining lift above a certain exposure count, that is the data telling you to reallocate impressions to reach rather than frequency. Spending more to reach the same person a tenth time is lighting capital on fire when there are unconverted prospects who have not seen the ad at all.
Survey-based lift vs implicit measures: what each method actually captures
Survey-based lift studies are the industry standard because they are scalable, cost-effective, and directly measure the perceptions that matter for brand decisions. But they have a real limitation: they capture what people say, not necessarily what they feel or do.
Implicit measures, including biometric testing (galvanic skin response, facial coding), eye-tracking, and EEG-based attention measurement, capture subconscious responses that surveys cannot access. Eye-tracking reveals whether audiences actually looked at the brand logo or the product shot. Facial coding detects emotional valence in real time during ad exposure. These methods are more expensive, require controlled environments or specialized panels, and are harder to scale across large campaigns.
The practical decision rule: use survey-based lift for campaign-level measurement at scale. Use implicit measures for creative pre-testing and deep-dive diagnostics on specific executions, particularly in categories where emotional resonance is the primary purchase driver. The two methods answer different questions and work best in combination, not competition.
How lift measurement differs across digital video, social, and TV
The channel shapes both the measurement approach and the benchmarks.
Digital video (YouTube, connected TV, streaming) is the most measurement-friendly environment. Platform-native tools like Google Brand Lift and Amazon Brand Lift are built for this inventory, and the exposed/control design is clean because ad serving is logged at the user level. Lift tends to be measurable within 2–4 weeks at sufficient spend levels.
Social media (Meta, TikTok, LinkedIn) offers platform-native lift tools with similar exposed/control logic, but the fragmented creative formats (feed, Stories, Reels) mean you often need creative-level breakouts to understand which format drove the lift. Frequency caps are harder to enforce across social, which increases contamination risk.
Linear TV is the hardest to measure with traditional lift methodology because individual exposure cannot be tracked at the user level. Measurement relies on panel-based approaches, set-top box data, or matched-market designs where exposed and unexposed geographic markets are compared. The detectable-lift thresholds are higher, the field periods are longer, and the results are less precise. That does not make TV unmeasurable; it means the methodology requires more investment and more patience to produce reliable results.
Across all channels, the principle holds: the study design must match the channel's exposure mechanics. A methodology built for digital video will not produce valid results for a linear TV campaign without significant adaptation.
Key Takeaways
Brand lift measurement produces reliable, decision-grade results only when the study is designed before the campaign launches, with a pre-specified primary KPI, a validated control group, and sufficient sample size to detect the lift threshold that actually matters for the business.
| Point | Details |
|---|---|
| Align metric to objective | Pick one primary KPI before launch: awareness for brand campaigns, consideration or intent for mid-funnel. |
| Plan sample size first | Calculate required responses from your detectable-lift threshold; underpowered studies return noise, not insight. |
| Validate the control group | Check control-group recall post-study; contaminated controls underestimate campaign impact and invalidate conclusions. |
| Pair lift with behavioral signals | Combine lift results with branded search volume and direct traffic to validate whether perception shifts are moving downstream. |
| Ashafrazier's approach | Ashafrazier builds integrated measurement frameworks that connect lift studies to dashboards, behavioral signals, and CAC impact for growth decisions. |
What most teams get wrong about brand lift
The conventional wisdom says brand lift is a reporting exercise. Run the study, get the number, put it in the deck. That framing is exactly why most lift programs produce data that nobody acts on.
The teams that get real value from lift measurement treat it as a diagnostic system, not a scorecard. They design studies to answer specific optimization questions: which creative drove the message association? Which audience segment showed the strongest consideration lift? Where did frequency hit diminishing returns? Those questions have to be built into the study design before the campaign launches. You cannot reverse-engineer them from aggregate results after the fact.
The other thing most teams underestimate is the relationship between lift and behavioral signals. A +6-point lift in consideration is interesting. A +6-point lift in consideration that coincides with a 20% increase in branded search volume is a growth signal. The lift study gives you the causal attribution; the behavioral data gives you the downstream validation. Neither is sufficient alone. Building that combined view into a growth marketing dashboard is the difference between a measurement program that informs budget decisions and one that just justifies spend that was already committed.
One more thing worth saying directly: a single lift study is not a brand measurement program. It is a data point. The compounding value comes from consistent methodology across campaigns, which builds the benchmarks that let you actually interpret what a +4-point lift means for your brand specifically, not just relative to a generic industry average.
Measurement frameworks that translate lift into growth decisions
Most brand lift studies end with a PDF report. Ashafrazier builds the system that comes after it.
The work starts with designing the measurement framework: defining the right KPIs for each campaign type, setting detectable-lift thresholds before budget is committed, and building the exposed/control logic that produces results you can actually defend. From there, it extends to integrated dashboards that combine lift outputs with branded search, direct traffic, and conversion data so leadership sees a coherent picture of how brand investment is compounding into revenue. For companies where brand measurement is tied to valuation or a capital event, that integrated view is not optional.
If you want to see how this translates to real outcomes, the case study with The RealReal shows what integrated measurement and paid media can produce at scale. To model the downstream impact of a perception shift on your own CAC and LTV, the Growth Score Calculator is the fastest starting point. Or if you want to talk through your measurement setup directly, start here.
Useful sources and further reading
- Google Brand Lift: About Brand Lift — Google's official documentation on how Brand Lift works, eligibility requirements, available metrics, and the exposed/control methodology used in YouTube campaigns.
- Google Brand Lift: Setup Guide — Step-by-step setup instructions, budgeting tables, Standard vs Enhanced Lift options, and the measurement eligibility calculator.
- Dynata: Why You Need Brand Lift Studies — Practitioner overview of study design, control-group integrity, contamination risks, and timing guidance.
- Dynata: Brand Lift Measurement Key Metrics — Detailed breakdown of the six core brand lift metrics, best practices for study design, and how to connect lift to ROI.
- Happydemics: The Complete Guide to Running a Brand Lift Study — Covers absolute vs relative lift formulas, benchmark guidance, study types, and the distinction between lift studies and continuous tracking.
- Amazon Ads: Brand Lift — Amazon's approach to brand lift measurement, including audience segment breakouts, frequency analysis, and privacy-safe panel methodology.
- MetricNexus: Brand Awareness Metrics — Covers respondent sourcing (panels vs on-site), dashboard construction, and how to combine lift with behavioral KPIs.
- Benly: Brand Health Tracking KPIs and Dashboard Setup — Explains how branded search volume functions as a leading behavioral indicator and how to build a dashboard that connects lift to downstream signals.