
AI in marketing analytics is the application of machine learning, natural language processing, and causal modeling to transform raw customer and campaign data into forward-looking decisions that move revenue. The single most important benefit: it shifts your team from reporting what happened to predicting and influencing what happens next.
Three facts worth anchoring to before you go further:
- AI adoption across organizations reached roughly 72% in 2024, yet most teams still rely on descriptive dashboards that tell them last week's story.
- The highest-payback applications, including predictive lead scoring, churn prediction, and LTV forecasting, require clean first-party behavioral data and resolved identity before any model delivers reliable output.
- Google's August 2026 launch of Ask Advisor inside Google Ads and Analytics signals that agentic, conversational analytics is now a standard expectation, not a differentiator.
If your analytics stack still centers on last-touch attribution and weekly pivot tables, the gap between you and high-performing competitors is widening fast. The sections below give you a practical roadmap to close it.
Key Takeaways
AI in marketing analytics only compounds when data readiness, causal measurement, and operationalized model outputs are built together, not sequenced as separate projects.
| Point | Details |
|---|---|
| Data before models | Identity resolution and clean pipelines must precede any model build or platform purchase. |
| Causal beats predictive for interventions | Uplift models prevent wasted spend on customers who convert regardless of your action. |
| Holdouts are non-negotiable | Statistically valid holdout experiments are the only way to produce a defensible ROI number. |
| DDA and MMM must reconcile | Path-level and macro-level attribution contradict each other without calibration; align them before making budget decisions. |
| Ashafrazier accelerates pilots | Ashafrazier designs and operationalizes AI analytics pilots, from data readiness to holdout measurement, within a single quarter. |
Table of Contents
- What AI in marketing analytics actually includes
- High-value AI use cases that move real metrics
- The technology stack you actually need
- A step-by-step framework for adopting AI-driven analytics
- How to measure impact and avoid the most common traps
- Ethics, privacy, and governance before you scale
- Vendor and platform categories worth evaluating
- What high-performing organizations do differently
- An 8-step checklist to start this quarter
- The trap most teams fall into, and what actually works
- What Ashafrazier can build with you
- Sources
What AI in marketing analytics actually includes
Traditional analytics is descriptive: it counts sessions, clicks, and conversions after the fact. AI-driven marketing analytics adds three layers on top of that foundation that change what decisions you can make and how fast you can make them.
The core components:
The data layer is where everything starts: ingestion pipelines pulling CRM records, ad platform events, web behavior, email engagement, and offline transaction data into a unified store. Without this layer working cleanly, every model downstream is unreliable. Robust pipelines and identity resolution are prerequisites, not nice-to-haves.
Feature engineering converts raw events into signals a model can use: recency of last purchase, frequency of site visits, product category affinity, days since last email open. This step is where domain expertise matters most, and where most teams underinvest.
ML and predictive models sit on top of those features: classification models for churn or lead scoring, regression models for LTV or spend forecasting, recommendation engines for personalization. These are the tools most people picture when they hear "AI in marketing."
NLP extends the same logic to unstructured data: customer reviews, support tickets, social mentions, and voice transcripts. Sentiment analysis, topic modeling, and intent classification all fall here.
Causal and uplift models are the most underused layer. Where predictive models answer "who is likely to convert?", uplift models answer "who converts because of our intervention?" That distinction prevents you from spending budget on customers who would have bought anyway.
Model deployment and agentic analytics close the loop: serving model outputs into ad platforms, CRMs, and email tools in near real time, and increasingly surfacing those outputs through conversational agents that suggest actions rather than just display numbers.
| Dimension | Traditional analytics | AI-driven analytics |
|---|---|---|
| Primary output | Descriptive reports, dashboards | Predictions, recommendations, causal estimates |
| Decision speed | Weekly or monthly review cycles | Near real-time scoring and activation |
| Attribution | Last-touch or rule-based | Data-driven, causal, or MMM-calibrated |
| Personalization | Segment-level rules | Individual-level model scores |
| Analyst role | Report builder | Model validator and decision designer |
Pro Tip: Use causal or uplift models instead of standard predictive models any time the downstream action is a marketing intervention (a discount, an email, a retargeting ad). A predictive model tells you who is likely to buy; an uplift model tells you who buys more because you acted. Confusing the two is one of the most expensive mistakes in marketing analytics.
High-value AI use cases that move real metrics
Not every use case pays back at the same speed. Some deliver measurable lift within a single quarter; others require a year of data and infrastructure investment before they prove out. Knowing which is which determines where to start.
Fast-payback use cases (first 90 days of a pilot):
- Predictive lead scoring: Ranks inbound leads by conversion probability using behavioral and firmographic signals. Moves sales efficiency metrics: contact-to-opportunity rate, pipeline velocity, and CAC.
- Churn prediction: Flags at-risk customers 30–60 days before they lapse, enabling retention campaigns timed to the inflection point. Moves net revenue retention and customer lifetime value.
- Spend forecasting: Predicts budget requirements to hit a revenue target given current channel efficiency. Moves ROAS and prevents over- or under-investment in paid channels.
- Creative performance scoring: Scores ad creative variants on predicted CTR or conversion rate before full spend is committed. Moves creative testing velocity and reduces wasted impressions.
Medium-term platform bets (3–12 months):
- Audience segmentation and personalization: Clusters customers by behavioral patterns and serves individualized content, offers, or product recommendations. Moves conversion rate and average order value at scale.
- Uplift modeling for targeting: Identifies the persuadable segment, the customers who respond to an offer but would not have converted without it. Prevents budget waste on "sure things" and "lost causes" alike.
- Multi-touch attribution (MTA) and data-driven attribution (DDA): Distributes credit across touchpoints using model weights rather than arbitrary rules. Moves budget allocation accuracy and channel-level ROAS.
Long-term infrastructure investments:
- Marketing Mix Modeling (MMM): A macro-level econometric model that estimates the revenue contribution of each channel, including offline and brand spend, across a long time horizon. LinkedIn's LiDDA work demonstrates how transformer-based DDA can be calibrated against MMM outputs so path-level and macro-level attribution align rather than contradict each other.
- Agentic analytics: AI agents embedded in ad platforms and analytics tools that surface anomalies, suggest bid adjustments, and draft campaign briefs. Google's Ask Advisor is the clearest current example of this shift.
The practical rule: start with a use case tied to a decision that costs real money today. Lead scoring and churn prediction consistently deliver early payback because the downstream action (a sales call, a retention email) is already in place. MMM and full DDA require more data history and cross-functional alignment before they pay out.
The technology stack you actually need
Architecture decisions made early either compound or constrain everything that follows. The right stack is not the most expensive one; it is the one where each layer feeds the next without manual intervention.
Ingestion and identity resolution
Data arrives from ad platforms, CRMs, web analytics, email tools, and offline systems in incompatible formats and on different schedules. A customer data platform (CDP) or modern data warehouse (Snowflake, BigQuery, Databricks) consolidates these streams and resolves them to a single customer identity. Identity resolution, matching a user across devices, sessions, and channels, is the single most important capability to get right before modeling begins.

Modeling layer
The modeling layer sits on top of the warehouse and handles feature engineering, model training, versioning, and experiment tracking. MLOps platforms (Vertex AI, SageMaker, Databricks MLflow) manage this. What to insist on: reproducible pipelines, model versioning, and automated retraining triggers when data drift is detected.
Serving and activation
A model that lives in a notebook produces no revenue. Serving infrastructure pushes model scores into the systems that act on them: bid management platforms, email ESPs, CRM lead queues, and personalization engines. Latency requirements vary sharply by use case. Real-time personalization needs sub-100ms scoring; churn prediction can run as a nightly batch job.
Observability and governance
Every model in production needs monitoring: input data quality checks, output distribution tracking, and performance metrics against holdout groups. Without this layer, model decay goes undetected and decisions quietly degrade.
| Stack layer | Core capability | Key evaluation question |
|---|---|---|
| Data ingestion | Unified event collection, schema normalization | Does it handle all your source systems without custom ETL for each? |
| Identity resolution | Cross-device, cross-channel customer matching | Does it resolve identity in near real time or only in batch? |
| Modeling layer | Feature store, training pipelines, MLOps | Does it support experiment tracking and automated retraining? |
| Serving/activation | Low-latency scoring, CRM/ad platform push | What is the latency for real-time use cases? |
| Observability | Data quality monitoring, model drift detection | Does it alert on input drift before model performance degrades? |

One operational callout worth emphasizing: offline features (historical aggregates like "total purchases in last 90 days") are cheap to compute but require a feature store to serve consistently between training and inference. Skipping the feature store creates training-serving skew, a subtle but common cause of models that perform well in evaluation and poorly in production.
A step-by-step framework for adopting AI-driven analytics
The most common failure mode is buying a platform before the data is ready to use it. The framework below is sequenced to prevent that.
-
Define the decision and the metric. Name the specific business decision the model will inform (which leads to call first, which customers to suppress from a campaign, how to allocate next quarter's budget). Attach a single primary metric that changes if the model works. Vague goals produce unvalidatable models.
-
Audit data readiness. Map every data source the model needs. Check for completeness, freshness, and label quality. For a churn model, you need behavioral events, subscription status, and actual churn dates. For lead scoring, you need CRM disposition data tied to marketing touchpoints. Missing labels are the most common blocker.
-
Resolve identity. Before modeling, confirm that a customer's web sessions, email clicks, ad exposures, and CRM record are linked to a single ID. Without this, your feature set is fragmented and your model trains on noise.
-
Choose the right model type. Match the model to the decision: classification for churn or lead scoring, regression for LTV or spend forecasting, uplift for targeting interventions. Start with the simplest model that answers the specific business question before adding complexity.
-
Run a holdout experiment. Split your audience into a treatment group (receives model-informed action) and a holdout group (receives business-as-usual). Measure the difference in your primary metric. This is the only way to produce a defensible ROI number.
-
Integrate outputs into activation systems. Push model scores into the system that acts on them: the CRM lead queue, the email platform's suppression list, the bid management tool's audience segment. A model score that lives only in a dashboard changes nothing.
-
Monitor and retrain. Track input data quality and output distribution weekly. Set automated alerts for drift. Schedule retraining when performance against holdout degrades past a defined threshold.
-
Scale what works, kill what does not. A pilot that shows statistically significant lift in the holdout gets resourced for scale. One that does not gets documented and retired. Sunk-cost thinking on underperforming models is one of the most common budget drains in analytics teams.
A focused pilot on a single use case, lead scoring or churn prediction, typically runs 8–12 weeks from data audit to first holdout results. That timeline assumes identity resolution is already in place; add 4–6 weeks if it is not.
Pro Tip: Align a downstream action to the model output before you build the model. If there is no sales cadence change, email trigger, or bid rule waiting to receive the score, the model has no mechanism to move revenue. Define the action first, then build the model that informs it.
How to measure impact and avoid the most common traps
Choosing the wrong success metric is as damaging as choosing the wrong model. The table below maps use cases to the metrics that actually reflect incremental impact.
| Use case | Primary KPI | Preferred measurement method |
|---|---|---|
| Lead scoring | Contact-to-opportunity rate, CAC | Holdout test: scored vs. unscored leads |
| Churn prediction | Net revenue retention, LTV lift | Holdout: treated vs. control cohort |
| Personalization | Conversion rate lift, AOV | A/B test with statistical significance |
| MMM / budget allocation | Incremental revenue per channel | Geo holdout or time-series experiment |
| DDA / MTA | Channel ROAS, budget shift accuracy | Calibration against MMM or RCT results |
The most defensible attribution requires combining experiments with models. CausalMTA research shows that removing confounding bias from user preferences produces more accurate multi-touch attribution and better counterfactual predictions. Observational ML alone, trained on who clicked what, inherits the selection bias baked into your media buying. Users who see your retargeting ad are not a random sample; they already showed intent. A model trained on that data will overvalue retargeting and undervalue upper-funnel channels.
Amazon's research on multi-touch attribution reinforces the same point: ML-only attribution from observational data can be systematically biased, and combining RCTs or causal calibration with ML models is what produces defensible channel-level credit.
Three pitfalls that consistently inflate reported performance:
Overfitting to historical patterns. A model trained on last year's data during a period of unusual demand (a product launch, a pandemic-era spike) will misfire when conditions normalize. Always validate on a time-held-out test set, not just a random split.
Selection bias in holdouts. If your holdout group is not randomly assigned, the comparison is not clean. Customers who opted out of a campaign, or who were excluded for operational reasons, are not a valid control group.
Last-touch as a sanity check. Last-touch attribution is not a baseline; it is a known distortion. Using it to validate a new model's output is circular. Use geo holdouts or incrementality tests as the ground truth instead.
The growth marketing KPIs dashboard framework is a practical complement here: once your models are live, you need a monitoring layer that surfaces incremental metrics, not just aggregate performance, so model decay does not hide behind a rising tide of organic demand.
Ethics, privacy, and governance before you scale
Governance is not a compliance checkbox. It is the operational layer that keeps model outputs trustworthy and legally defensible as you scale.
The main risks to address before deployment:
- Model bias: A churn model trained on historical data may systematically underserve customer segments that were previously undermarketed to. Audit model outputs by demographic and behavioral segment before production.
- Opaque scoring: A lead score that sales cannot interpret creates distrust and non-adoption. Explainability tools (SHAP values, LIME) should be standard for any model that informs a human decision.
- Consent drift: Customer data collected under one consent framework (a 2019 cookie policy) may not legally support the use case you are building today. Map data lineage to consent records before training.
- Excessive personalization: Hyper-targeted messaging based on inferred health, financial, or behavioral signals can cross into territory that damages brand trust even when it is technically legal.
Practical governance controls:
- Maintain a data lineage registry that maps every training feature to its source system and consent basis.
- Require audit logs for every model prediction that informs a customer-facing action.
- Set a model review cadence (quarterly minimum) that includes bias audits and performance against holdout.
- Apply privacy-preserving techniques (differential privacy, data minimization, synthetic data for testing) where regulatory requirements or brand risk warrant them.
- Designate a model owner for every production model: one person accountable for performance, retraining, and retirement.
Privacy regulations vary by jurisdiction and data type. Confirm your data practices with qualified legal counsel before deploying models that use sensitive behavioral or demographic signals.
Vendor and platform categories worth evaluating
The market is fragmented. Buying a single "AI marketing platform" rarely solves the full problem. The more useful frame is to evaluate by layer and ask the right question for each.
| Vendor category | Primary value | Key buyer question |
|---|---|---|
| Customer data platform (CDP) | Identity resolution, unified customer profile | Does it resolve identity in near real time across web, mobile, and offline? |
| Cloud data warehouse | Scalable storage and compute for modeling | Does it support feature stores and ML workloads natively, or only SQL analytics? |
| MLOps platform | Model training, versioning, deployment, monitoring | Does it support automated retraining and drift alerting in production? |
| BI and visualization | Stakeholder reporting, anomaly surfacing | Does it connect directly to model outputs, or only to aggregated tables? |
| Experimentation platform | A/B testing, holdout management, statistical analysis | Does it support pre-registration and sequential testing to prevent p-hacking? |
| Activation and media platforms | Pushing model scores to ads, email, CRM | What is the latency for audience sync, and does it support custom model scores? |
On the build-vs.-buy question: most teams should buy the data infrastructure (warehouse, CDP, BI) and build or customize the models. The models are where your competitive differentiation lives; the infrastructure is commodity. The exception is teams with fewer than three data engineers, where buying a managed ML platform (Vertex AI, SageMaker) is almost always faster than building MLOps from scratch.
Where external help accelerates time to value most: pilot design, attribution setup, and the first 90 days of operationalization. These are the phases where the cost of a wrong architectural decision is highest and where experienced implementation support pays back quickly. The CAC reduction case study from a B2B marketplace illustrates how a focused, timeboxed engagement on attribution and paid media can produce measurable unit economics improvement without a multi-year platform overhaul.
What high-performing organizations do differently
The gap between organizations that realize ROI from AI in marketing analytics and those that do not is rarely about tool choice. UC Berkeley Executive Education and Snowflake executives identify data skills and integrated analytics frameworks as the primary barrier, not technology access.
High performers share a consistent set of operational habits:
- They start with a decision, not a dataset. Every analytics investment is tied to a specific business question with a named decision-maker and a downstream action.
- They invest in identity resolution before models. Clean, unified customer IDs are the foundation. Teams that skip this step build models on fragmented data and wonder why performance does not transfer to production.
- They run holdout experiments as standard practice. Incremental measurement is not a special project; it is how every significant campaign is evaluated.
- They integrate DDA with MMM. Path-level attribution and macro-level mix modeling answer different questions and often contradict each other when run independently. LinkedIn's LiDDA calibration approach is a documented, industry-scale example of reconciling the two.
- They treat agentic analytics as an acceleration layer. Google's Ask Advisor and similar in-product agents compress the insight-to-action cycle. High performers are already building workflows around these agents rather than waiting for them to mature.
The 72% AI adoption figure masks a wide performance distribution. Adoption does not equal ROI. The organizations generating compounding returns are the ones that paired tool investment with data governance, cross-functional alignment, and a bias toward causal measurement over observational reporting.
An 8-step checklist to start this quarter
This checklist is designed for a 30–90 day window. Each step maps to a person, a process, or a technology decision.
-
Name the decision. Write one sentence: "We will use a model to decide [X], which will change [metric] by [direction]." Get sign-off from the business owner of that metric. Owner: CMO or VP of Growth.
-
Audit your data. List every data source the model needs. Check completeness, freshness, and label availability. Flag gaps. Owner: Head of Data or Marketing Ops.
-
Resolve identity. Confirm that web, CRM, ad platform, and email data share a common customer ID. If not, this is the first infrastructure task. Owner: Data Engineering.
-
Pick one model type. Choose classification (churn, lead scoring), regression (LTV, spend), or uplift (targeting) based on the decision from Step 1. Do not run all three simultaneously. Owner: Data Science or Analytics.
-
Design the holdout. Before any model runs in production, define the control group, the treatment group, the primary metric, and the minimum detectable effect. Owner: Analytics or Growth.
-
Connect the output to an action. Map the model score to a specific system: CRM queue, email suppression list, bid audience. Confirm the integration works before the pilot launches. Owner: Marketing Ops.
-
Run the pilot for 6–8 weeks. Minimum success criterion: statistically significant lift in the primary metric versus holdout, with a CAC or ROAS improvement that covers the cost of the model build. Owner: Growth or Analytics.
-
Document and decide. Write a one-page summary: what worked, what did not, what the next iteration requires. Present to leadership with a scale or kill recommendation. Owner: CMO or Growth Lead.
A pilot that clears the minimum success criterion in Step 7 earns the budget for the next layer of the stack. One that does not still produces valuable data about where the data or process gaps are.
The trap most teams fall into, and what actually works
The pattern I see most often: a team buys a sophisticated analytics platform, spends three months on implementation, and then discovers that the underlying data is too fragmented to train a reliable model. The platform is not the problem. The data is.
The organizations that compound results from AI in marketing analytics share one habit that is easy to describe and hard to execute: they treat data infrastructure as a strategic asset, not an IT cost center. That means funding identity resolution before model development, assigning ownership to data quality the same way you assign ownership to a campaign, and building holdout measurement into every significant spend decision from day one.
The second trap is organizational. Analytics teams build models; marketing teams run campaigns; sales teams work leads. When those functions do not share a feedback loop, model outputs go stale and adoption collapses. The fix is not a better model. It is a weekly ritual where the model owner and the downstream action owner review performance together and agree on the next adjustment.
On the question of when to bring in external help: if your team is still resolving identity manually, has never run a holdout experiment, or is evaluating three platforms simultaneously without a clear decision framework, that is the moment to engage someone who has built this before. The cost of a wrong architectural decision in the first 90 days compounds for years. The 60-day turnaround case study is a concrete example of what a focused, timeboxed engagement can produce when the right priorities are set from the start.
What Ashafrazier can build with you
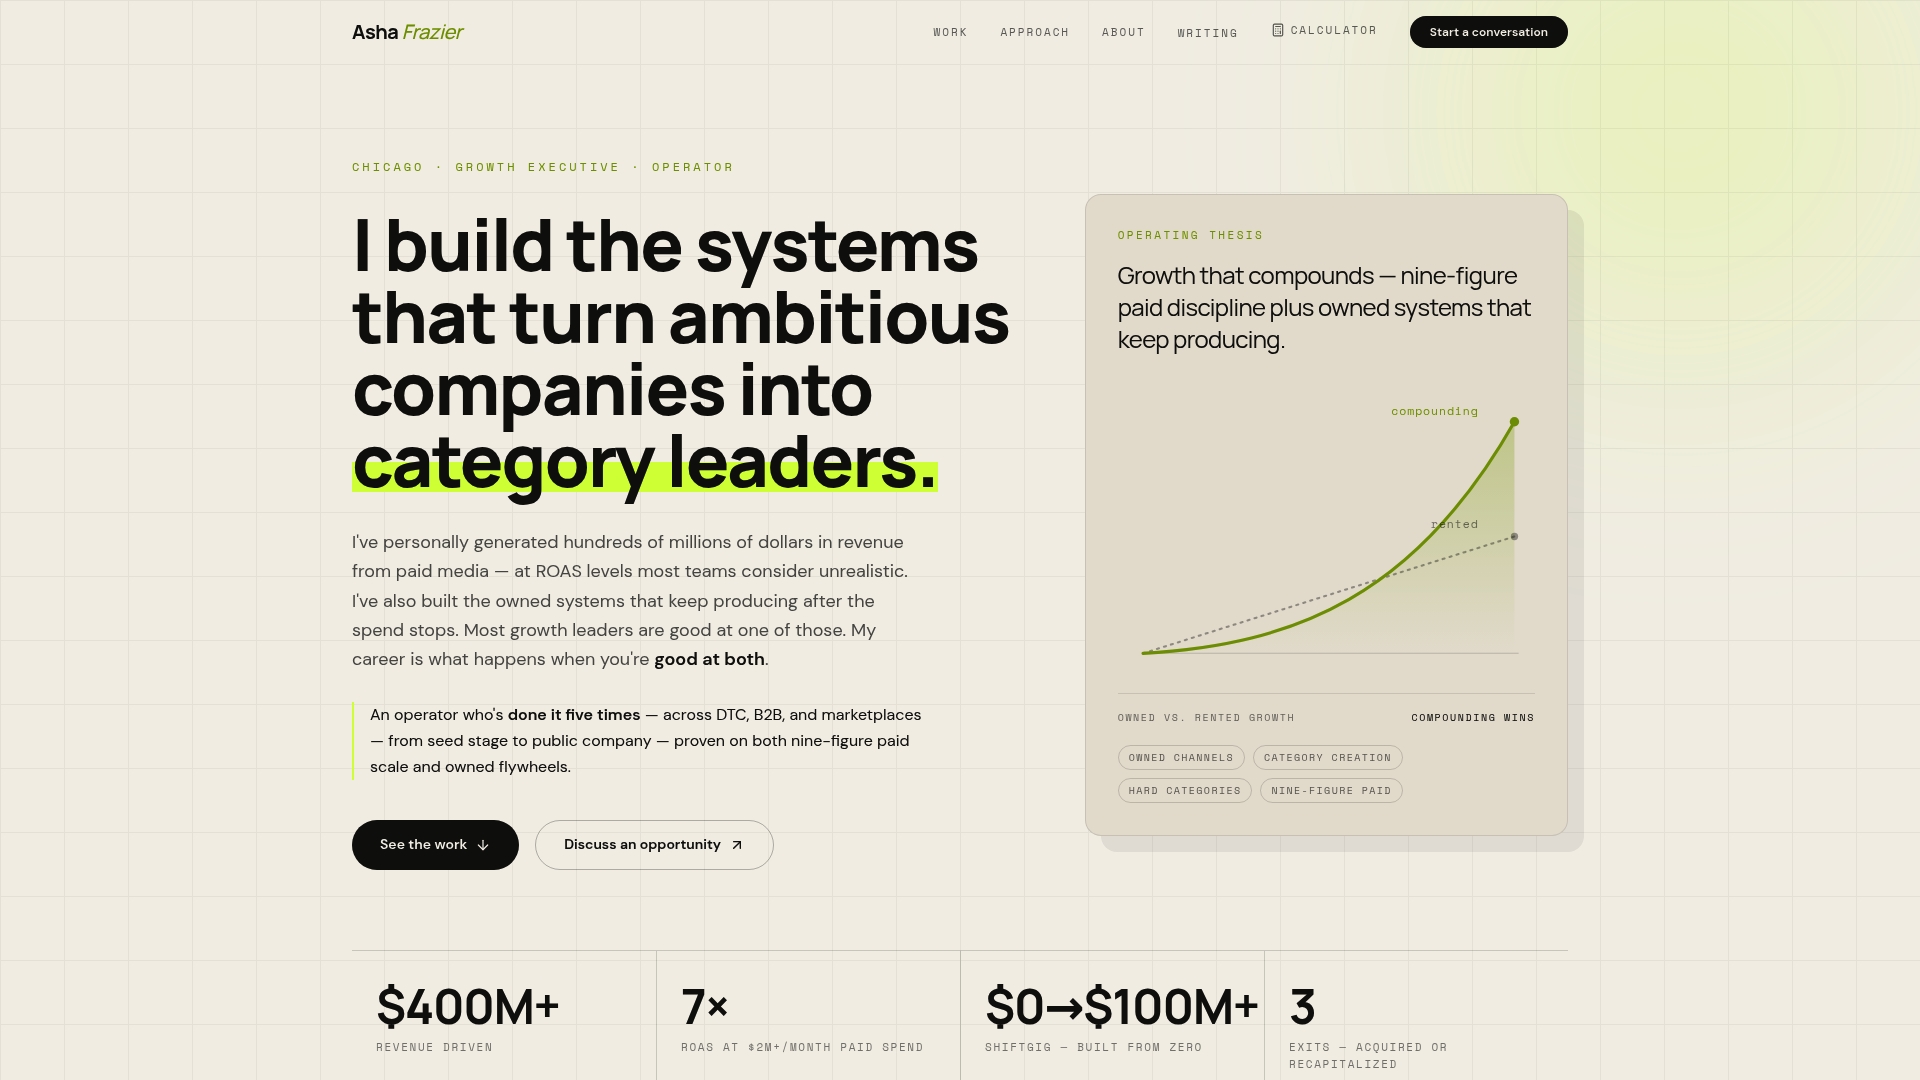
Ashafrazier works with growth executives and founders who need to move from fragmented analytics to a system that produces repeatable, measurable revenue outcomes. The work covers the full stack: data readiness audits, identity resolution architecture, attribution setup, pilot design, holdout experiment frameworks, and operationalizing model outputs into paid media and lifecycle channels.
A typical engagement runs 8–12 weeks for a focused pilot, with clear deliverables at each phase: a data readiness assessment in week two, a working model and holdout design by week six, and a documented scale-or-kill recommendation by week ten. The goal is not a dashboard. It is a decision system tied to a metric that matters.
If you want to pressure-test your current analytics setup before committing to a platform or a model build, the Growth Score Calculator gives you a fast read on where your LTV, CAC, and payback metrics stand relative to what a well-instrumented growth system should produce. For teams ready to move faster, Ashafrazier's consulting engagements are structured to get a pilot live and measured within a single quarter.
Sources
The sources below are the most substantive references used in this article, organized by what each is best for.
- Try new AI tools from Google Ads and Analytics
- Predictive Analytics in Marketing: A Guide | ObserviX
- CausalMTA: Eliminating the User Confounding Bias for Causal Multi-touch Attribution
- Predictive marketing (HubSpot blog)
Recommended
- The Essential Growth Marketing KPIs: Building a Dashboard That Drives Decisions — Asha Frazier
- Things I've Learned — Asha Frazier
- Lowering CAC in a B2B Marketplace: From $150 to $11 Per Brand — Asha Frazier
- The Growth Marketing Playbook for Series A Startups: From Product-Market Fit to Scale — Asha Frazier